Immigrants from Croatia vs Immigrants from South Eastern Asia Disability Age Over 75
COMPARE
Immigrants from Croatia
Immigrants from South Eastern Asia
Disability Age Over 75
Disability Age Over 75 Comparison
Immigrants from Croatia
Immigrants from South Eastern Asia
45.5%
DISABILITY AGE OVER 75
99.9/ 100
METRIC RATING
33rd/ 347
METRIC RANK
48.7%
DISABILITY AGE OVER 75
0.7/ 100
METRIC RATING
252nd/ 347
METRIC RANK
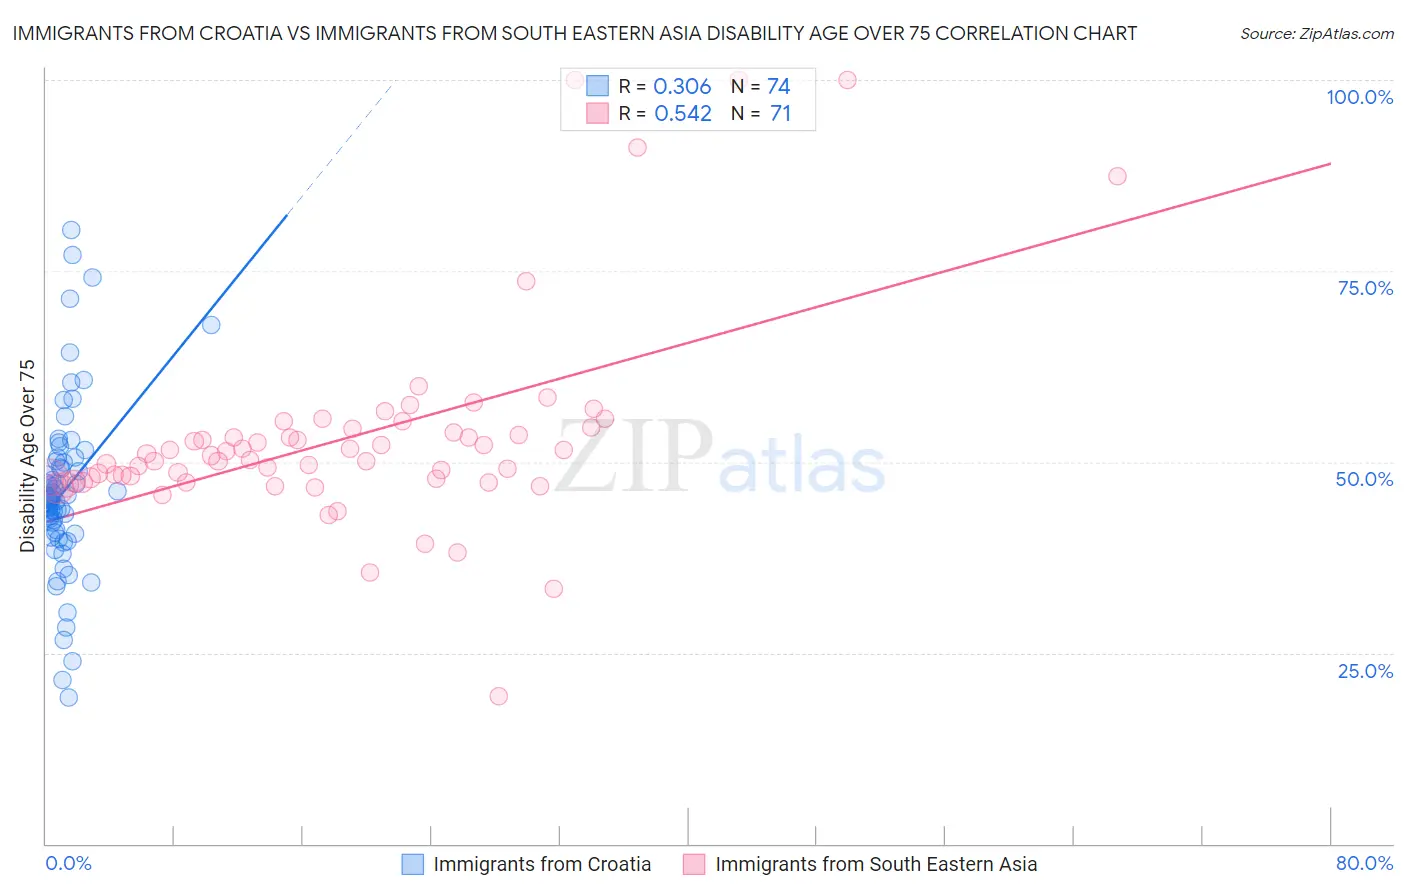
Immigrants from Croatia vs Immigrants from South Eastern Asia Disability Age Over 75 Correlation Chart
The statistical analysis conducted on geographies consisting of 132,556,721 people shows a mild positive correlation between the proportion of Immigrants from Croatia and percentage of population with a disability over the age of 75 in the United States with a correlation coefficient (R) of 0.306 and weighted average of 45.5%. Similarly, the statistical analysis conducted on geographies consisting of 511,260,020 people shows a substantial positive correlation between the proportion of Immigrants from South Eastern Asia and percentage of population with a disability over the age of 75 in the United States with a correlation coefficient (R) of 0.542 and weighted average of 48.7%, a difference of 7.0%.
Disability Age Over 75 Correlation Summary
| Measurement | Immigrants from Croatia | Immigrants from South Eastern Asia |
| Minimum | 19.1% | 19.3% |
| Maximum | 80.4% | 100.0% |
| Range | 61.3% | 80.7% |
| Mean | 46.2% | 53.2% |
| Median | 45.3% | 50.8% |
| Interquartile 25% (IQ1) | 40.8% | 47.7% |
| Interquartile 75% (IQ3) | 50.0% | 54.4% |
| Interquartile Range (IQR) | 9.3% | 6.7% |
| Standard Deviation (Sample) | 11.4% | 13.6% |
| Standard Deviation (Population) | 11.3% | 13.5% |
Similar Demographics by Disability Age Over 75
Demographics Similar to Immigrants from Croatia by Disability Age Over 75
In terms of disability age over 75, the demographic groups most similar to Immigrants from Croatia are Russian (45.5%, a difference of 0.030%), Norwegian (45.5%, a difference of 0.040%), Immigrants from Australia (45.5%, a difference of 0.060%), Immigrants from Taiwan (45.5%, a difference of 0.070%), and South African (45.5%, a difference of 0.070%).
| Demographics | Rating | Rank | Disability Age Over 75 |
| Macedonians | 99.9 /100 | #26 | Exceptional 45.4% |
| Immigrants | Poland | 99.9 /100 | #27 | Exceptional 45.4% |
| Thais | 99.9 /100 | #28 | Exceptional 45.4% |
| Filipinos | 99.9 /100 | #29 | Exceptional 45.4% |
| Immigrants | Denmark | 99.9 /100 | #30 | Exceptional 45.4% |
| Immigrants | Bulgaria | 99.9 /100 | #31 | Exceptional 45.5% |
| Immigrants | Australia | 99.9 /100 | #32 | Exceptional 45.5% |
| Immigrants | Croatia | 99.9 /100 | #33 | Exceptional 45.5% |
| Russians | 99.9 /100 | #34 | Exceptional 45.5% |
| Norwegians | 99.9 /100 | #35 | Exceptional 45.5% |
| Immigrants | Taiwan | 99.9 /100 | #36 | Exceptional 45.5% |
| South Africans | 99.9 /100 | #37 | Exceptional 45.5% |
| Italians | 99.9 /100 | #38 | Exceptional 45.6% |
| Estonians | 99.9 /100 | #39 | Exceptional 45.6% |
| Slovenes | 99.9 /100 | #40 | Exceptional 45.6% |
Demographics Similar to Immigrants from South Eastern Asia by Disability Age Over 75
In terms of disability age over 75, the demographic groups most similar to Immigrants from South Eastern Asia are British West Indian (48.7%, a difference of 0.040%), Immigrants from Vietnam (48.7%, a difference of 0.080%), Korean (48.6%, a difference of 0.10%), Chinese (48.7%, a difference of 0.11%), and West Indian (48.6%, a difference of 0.12%).
| Demographics | Rating | Rank | Disability Age Over 75 |
| Americans | 1.7 /100 | #245 | Tragic 48.4% |
| Chippewa | 1.6 /100 | #246 | Tragic 48.4% |
| Iroquois | 1.6 /100 | #247 | Tragic 48.4% |
| Sri Lankans | 1.4 /100 | #248 | Tragic 48.5% |
| Iraqis | 1.0 /100 | #249 | Tragic 48.6% |
| West Indians | 0.8 /100 | #250 | Tragic 48.6% |
| Koreans | 0.8 /100 | #251 | Tragic 48.6% |
| Immigrants | South Eastern Asia | 0.7 /100 | #252 | Tragic 48.7% |
| British West Indians | 0.6 /100 | #253 | Tragic 48.7% |
| Immigrants | Vietnam | 0.6 /100 | #254 | Tragic 48.7% |
| Chinese | 0.5 /100 | #255 | Tragic 48.7% |
| Immigrants | Congo | 0.5 /100 | #256 | Tragic 48.7% |
| Blackfeet | 0.5 /100 | #257 | Tragic 48.8% |
| Immigrants | Philippines | 0.4 /100 | #258 | Tragic 48.8% |
| Central Americans | 0.4 /100 | #259 | Tragic 48.8% |