Immigrants from Croatia vs Cypriot Hearing Disability
COMPARE
Immigrants from Croatia
Cypriot
Hearing Disability
Hearing Disability Comparison
Immigrants from Croatia
Cypriots
3.1%
HEARING DISABILITY
20.5/ 100
METRIC RATING
198th/ 347
METRIC RANK
2.8%
HEARING DISABILITY
92.9/ 100
METRIC RATING
110th/ 347
METRIC RANK
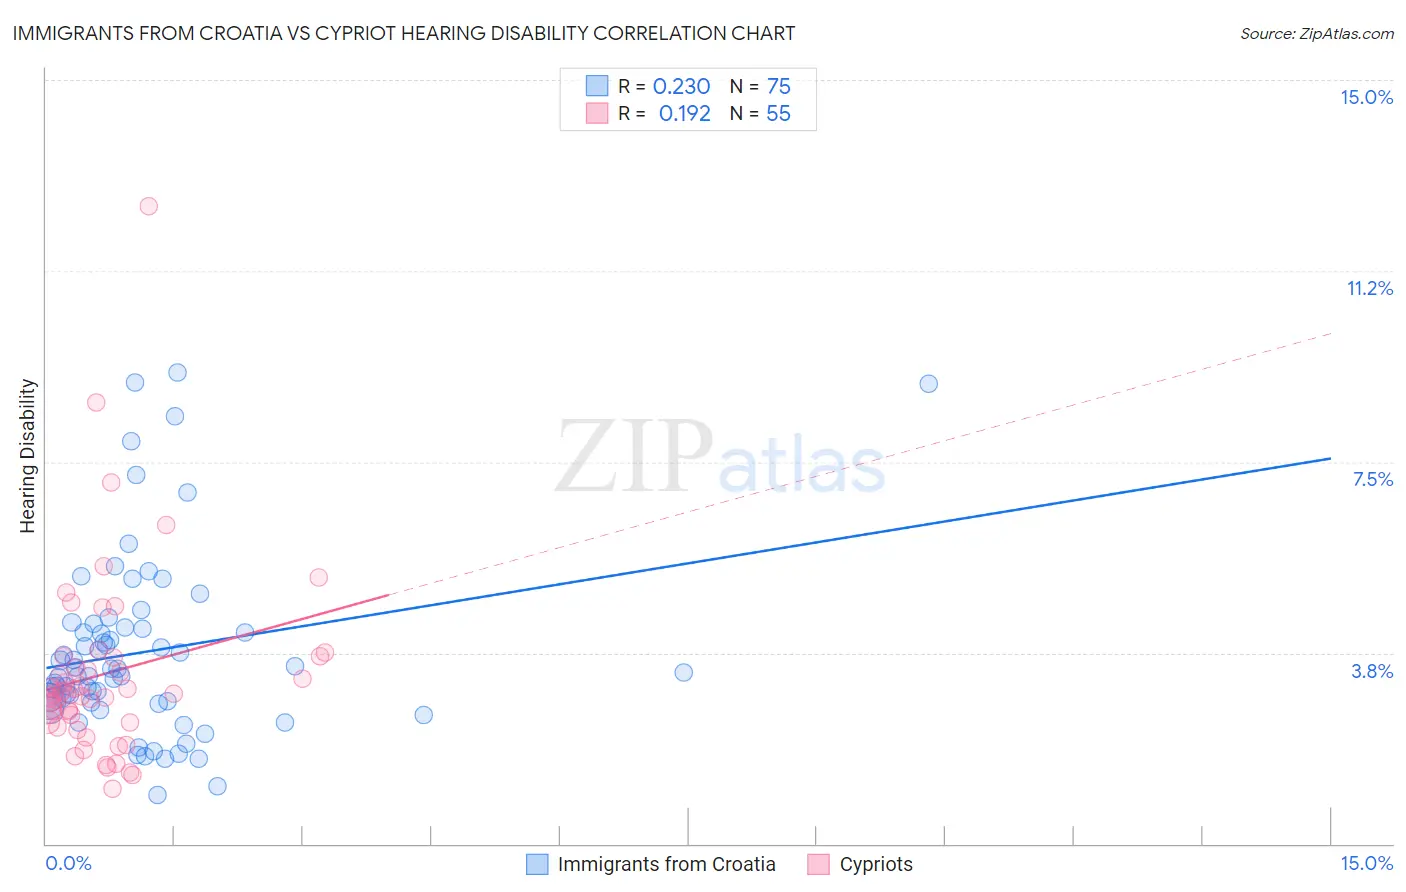
Immigrants from Croatia vs Cypriot Hearing Disability Correlation Chart
The statistical analysis conducted on geographies consisting of 132,571,835 people shows a weak positive correlation between the proportion of Immigrants from Croatia and percentage of population with hearing disability in the United States with a correlation coefficient (R) of 0.230 and weighted average of 3.1%. Similarly, the statistical analysis conducted on geographies consisting of 61,868,814 people shows a poor positive correlation between the proportion of Cypriots and percentage of population with hearing disability in the United States with a correlation coefficient (R) of 0.192 and weighted average of 2.8%, a difference of 9.8%.
Hearing Disability Correlation Summary
| Measurement | Immigrants from Croatia | Cypriot |
| Minimum | 0.95% | 1.1% |
| Maximum | 9.2% | 12.5% |
| Range | 8.3% | 11.4% |
| Mean | 3.8% | 3.3% |
| Median | 3.4% | 3.0% |
| Interquartile 25% (IQ1) | 2.8% | 2.4% |
| Interquartile 75% (IQ3) | 4.2% | 3.7% |
| Interquartile Range (IQR) | 1.5% | 1.3% |
| Standard Deviation (Sample) | 1.8% | 1.9% |
| Standard Deviation (Population) | 1.8% | 1.9% |
Similar Demographics by Hearing Disability
Demographics Similar to Immigrants from Croatia by Hearing Disability
In terms of hearing disability, the demographic groups most similar to Immigrants from Croatia are Immigrants from Bosnia and Herzegovina (3.1%, a difference of 0.020%), Syrian (3.1%, a difference of 0.18%), Immigrants from North Macedonia (3.1%, a difference of 0.19%), Iraqi (3.1%, a difference of 0.22%), and Immigrants from Europe (3.1%, a difference of 0.32%).
| Demographics | Rating | Rank | Hearing Disability |
| Immigrants | Switzerland | 28.8 /100 | #191 | Fair 3.1% |
| Koreans | 27.6 /100 | #192 | Fair 3.1% |
| Macedonians | 27.0 /100 | #193 | Fair 3.1% |
| South Africans | 24.5 /100 | #194 | Fair 3.1% |
| Spanish American Indians | 24.1 /100 | #195 | Fair 3.1% |
| Immigrants | Europe | 22.9 /100 | #196 | Fair 3.1% |
| Immigrants | Bosnia and Herzegovina | 20.6 /100 | #197 | Fair 3.1% |
| Immigrants | Croatia | 20.5 /100 | #198 | Fair 3.1% |
| Syrians | 19.2 /100 | #199 | Poor 3.1% |
| Immigrants | North Macedonia | 19.1 /100 | #200 | Poor 3.1% |
| Iraqis | 19.0 /100 | #201 | Poor 3.1% |
| Immigrants | Thailand | 16.4 /100 | #202 | Poor 3.1% |
| Immigrants | Denmark | 16.2 /100 | #203 | Poor 3.1% |
| Immigrants | Czechoslovakia | 15.9 /100 | #204 | Poor 3.1% |
| Alsatians | 15.9 /100 | #205 | Poor 3.1% |
Demographics Similar to Cypriots by Hearing Disability
In terms of hearing disability, the demographic groups most similar to Cypriots are Turkish (2.8%, a difference of 0.050%), Immigrants from Yemen (2.8%, a difference of 0.050%), Guatemalan (2.8%, a difference of 0.12%), U.S. Virgin Islander (2.8%, a difference of 0.12%), and Honduran (2.8%, a difference of 0.20%).
| Demographics | Rating | Rank | Hearing Disability |
| Immigrants | Indonesia | 94.7 /100 | #103 | Exceptional 2.8% |
| Burmese | 94.2 /100 | #104 | Exceptional 2.8% |
| Moroccans | 93.9 /100 | #105 | Exceptional 2.8% |
| Hondurans | 93.4 /100 | #106 | Exceptional 2.8% |
| Immigrants | Chile | 93.4 /100 | #107 | Exceptional 2.8% |
| Guatemalans | 93.2 /100 | #108 | Exceptional 2.8% |
| Turks | 93.0 /100 | #109 | Exceptional 2.8% |
| Cypriots | 92.9 /100 | #110 | Exceptional 2.8% |
| Immigrants | Yemen | 92.7 /100 | #111 | Exceptional 2.8% |
| U.S. Virgin Islanders | 92.5 /100 | #112 | Exceptional 2.8% |
| Immigrants | Belarus | 91.6 /100 | #113 | Exceptional 2.8% |
| Cambodians | 91.1 /100 | #114 | Exceptional 2.8% |
| Immigrants | Latin America | 90.5 /100 | #115 | Exceptional 2.8% |
| Immigrants | Immigrants | 90.3 /100 | #116 | Exceptional 2.8% |
| Immigrants | Liberia | 90.0 /100 | #117 | Excellent 2.8% |