Immigrants from Nicaragua vs Immigrants from Bahamas Disability Age 65 to 74

COMPARE

Immigrants from Nicaragua
Race
Ancestry
AfghanAfricanAlaska NativeAlaskan AthabascanAlbanianAleutAlsatianAmericanApacheArabArapahoArgentineanArmenianAssyrian/Chaldean/SyriacAustralianAustrianBahamianBangladeshiBarbadianBasqueBelgianBelizeanBermudanBhutaneseBlackfeetBolivianBrazilianBritishBritish West IndianBulgarianBurmeseCajunCambodianCanadianCape VerdeanCarpatho RusynCelticCentral AmericanCentral American IndianCherokeeCheyenneChickasawChileanChineseChippewaChoctawColombianColvilleComancheCosta RicanCreeCreekCroatianCrowCubanCypriotCzechCzechoslovakianDanishDelawareDominicanDutchDutch West IndianEastern EuropeanEcuadorianEgyptianEnglishEstonianEthiopianEuropeanFijianFilipinoFinnishFrenchFrench American IndianFrench CanadianGermanGerman RussianGhanaianGreekGuamanian/ChamorroGuatemalanGuyaneseHaitianHmongHonduranHopiHoumaHungarianIcelanderIndian (Asian)IndonesianInupiatIranianIraqiIrishIroquoisIsraeliItalianJamaicanJapaneseJordanianKenyanKiowaKoreanLaotianLatvianLebaneseLiberianLithuanianLumbeeLuxembourgerMacedonianMalaysianMalteseMarshalleseMenomineeMexicanMexican American IndianMongolianMoroccanNative HawaiianNavajoNepaleseNew ZealanderNicaraguanNigerianNorthern EuropeanNorwegianOkinawanOsageOttawaPaiutePakistaniPalestinianPanamanianParaguayanPennsylvania GermanPeruvianPimaPolishPortuguesePotawatomiPuebloPuerto RicanPuget Sound SalishRomanianRussianSalvadoranSamoanScandinavianScotch-IrishScottishSeminoleSenegaleseSerbianShoshoneSierra LeoneanSiouxSlavicSlovakSloveneSomaliSouth AfricanSouth AmericanSouth American IndianSoviet UnionSpaniardSpanishSpanish AmericanSpanish American IndianSri LankanSubsaharan AfricanSudaneseSwedishSwissSyrianTaiwaneseThaiTlingit-HaidaTohono O'OdhamTonganTrinidadian and TobagonianTsimshianTurkishU.S. Virgin IslanderUgandanUkrainianUruguayanUteVenezuelanVietnameseWelshWest IndianYakamaYaquiYugoslavianYumanYup'ikZimbabwean
Immigration
NonimmigrantsImmigrantsAfghanistanAfricaAlbaniaArgentinaArmeniaAsiaAustraliaAustriaBangladeshBarbadosBelarusBelgiumBelizeBoliviaBosnia and HerzegovinaBrazilBulgariaBurma/MyanmarCabo VerdeCambodiaCameroonCanadaCaribbeanCentral AmericaChileChinaColombiaCongoCosta RicaCroatiaCubaCzechoslovakiaDenmarkDominicaDominican RepublicEastern AfricaEastern AsiaEastern EuropeEcuadorEgyptEl SalvadorEnglandEritreaEthiopiaEuropeFijiFranceGermanyGhanaGreeceGrenadaGuatemalaGuyanaHaitiHondurasHong KongHungaryIndiaIndonesiaIranIraqIrelandIsraelItalyJamaicaJapanJordanKazakhstanKenyaKoreaKuwaitLaosLatin AmericaLatviaLebanonLiberiaLithuaniaMalaysiaMexicoMicronesiaMiddle AfricaMoldovaMoroccoNepalNetherlandsNicaraguaNigeriaNorth AmericaNorth MacedoniaNorthern AfricaNorthern EuropeNorwayOceaniaPakistanPanamaPeruPhilippinesPolandPortugalRomaniaRussiaSaudi ArabiaScotlandSenegalSerbiaSierra LeoneSingaporeSomaliaSouth AfricaSouth AmericaSouth Central AsiaSouth Eastern AsiaSouthern EuropeSpainSri LankaSt. Vincent and the GrenadinesSudanSwedenSwitzerlandSyriaTaiwanThailandTrinidad and TobagoTurkeyUgandaUkraineUruguayUzbekistanVenezuelaVietnamWest IndiesWestern AfricaWestern AsiaWestern EuropeYemenZaireZimbabweAzores
Immigrants from Bahamas
Race
Ancestry
AfghanAfricanAlaska NativeAlaskan AthabascanAlbanianAleutAlsatianAmericanApacheArabArapahoArgentineanArmenianAssyrian/Chaldean/SyriacAustralianAustrianBahamianBangladeshiBarbadianBasqueBelgianBelizeanBermudanBhutaneseBlackfeetBolivianBrazilianBritishBritish West IndianBulgarianBurmeseCajunCambodianCanadianCape VerdeanCarpatho RusynCelticCentral AmericanCentral American IndianCherokeeCheyenneChickasawChileanChineseChippewaChoctawColombianColvilleComancheCosta RicanCreeCreekCroatianCrowCubanCypriotCzechCzechoslovakianDanishDelawareDominicanDutchDutch West IndianEastern EuropeanEcuadorianEgyptianEnglishEstonianEthiopianEuropeanFijianFilipinoFinnishFrenchFrench American IndianFrench CanadianGermanGerman RussianGhanaianGreekGuamanian/ChamorroGuatemalanGuyaneseHaitianHmongHonduranHopiHoumaHungarianIcelanderIndian (Asian)IndonesianInupiatIranianIraqiIrishIroquoisIsraeliItalianJamaicanJapaneseJordanianKenyanKiowaKoreanLaotianLatvianLebaneseLiberianLithuanianLumbeeLuxembourgerMacedonianMalaysianMalteseMarshalleseMenomineeMexicanMexican American IndianMongolianMoroccanNative HawaiianNavajoNepaleseNew ZealanderNicaraguanNigerianNorthern EuropeanNorwegianOkinawanOsageOttawaPaiutePakistaniPalestinianPanamanianParaguayanPennsylvania GermanPeruvianPimaPolishPortuguesePotawatomiPuebloPuerto RicanPuget Sound SalishRomanianRussianSalvadoranSamoanScandinavianScotch-IrishScottishSeminoleSenegaleseSerbianShoshoneSierra LeoneanSiouxSlavicSlovakSloveneSomaliSouth AfricanSouth AmericanSouth American IndianSoviet UnionSpaniardSpanishSpanish AmericanSpanish American IndianSri LankanSubsaharan AfricanSudaneseSwedishSwissSyrianTaiwaneseThaiTlingit-HaidaTohono O'OdhamTonganTrinidadian and TobagonianTsimshianTurkishU.S. Virgin IslanderUgandanUkrainianUruguayanUteVenezuelanVietnameseWelshWest IndianYakamaYaquiYugoslavianYumanYup'ikZimbabwean
Immigration
NonimmigrantsImmigrantsAfghanistanAfricaAlbaniaArgentinaArmeniaAsiaAustraliaAustriaBahamasBangladeshBarbadosBelarusBelgiumBelizeBoliviaBosnia and HerzegovinaBrazilBulgariaBurma/MyanmarCabo VerdeCambodiaCameroonCanadaCaribbeanCentral AmericaChileChinaColombiaCongoCosta RicaCroatiaCubaCzechoslovakiaDenmarkDominicaDominican RepublicEastern AfricaEastern AsiaEastern EuropeEcuadorEgyptEl SalvadorEnglandEritreaEthiopiaEuropeFijiFranceGermanyGhanaGreeceGrenadaGuatemalaGuyanaHaitiHondurasHong KongHungaryIndiaIndonesiaIranIraqIrelandIsraelItalyJamaicaJapanJordanKazakhstanKenyaKoreaKuwaitLaosLatin AmericaLatviaLebanonLiberiaLithuaniaMalaysiaMexicoMicronesiaMiddle AfricaMoldovaMoroccoNepalNetherlandsNigeriaNorth AmericaNorth MacedoniaNorthern AfricaNorthern EuropeNorwayOceaniaPakistanPanamaPeruPhilippinesPolandPortugalRomaniaRussiaSaudi ArabiaScotlandSenegalSerbiaSierra LeoneSingaporeSomaliaSouth AfricaSouth AmericaSouth Central AsiaSouth Eastern AsiaSouthern EuropeSpainSri LankaSt. Vincent and the GrenadinesSudanSwedenSwitzerlandSyriaTaiwanThailandTrinidad and TobagoTurkeyUgandaUkraineUruguayUzbekistanVenezuelaVietnamWest IndiesWestern AfricaWestern AsiaWestern EuropeYemenZaireZimbabweAzores
Disability Age 65 to 74
Income
Poverty
Unemployment
Labor Participation
Family Structure
Vehicle Availability
Education Level
Disability

Disability Age 65 to 74 Comparison

Immigrants from Nicaragua

Immigrants from Bahamas

Tragic
Fair
24.1%
DISABILITY AGE 65 TO 74
9.8/ 100
METRIC RATING
221st/ 347
METRIC RANK
23.7%
DISABILITY AGE 65 TO 74
23.3/ 100
METRIC RATING
202nd/ 347
METRIC RANK

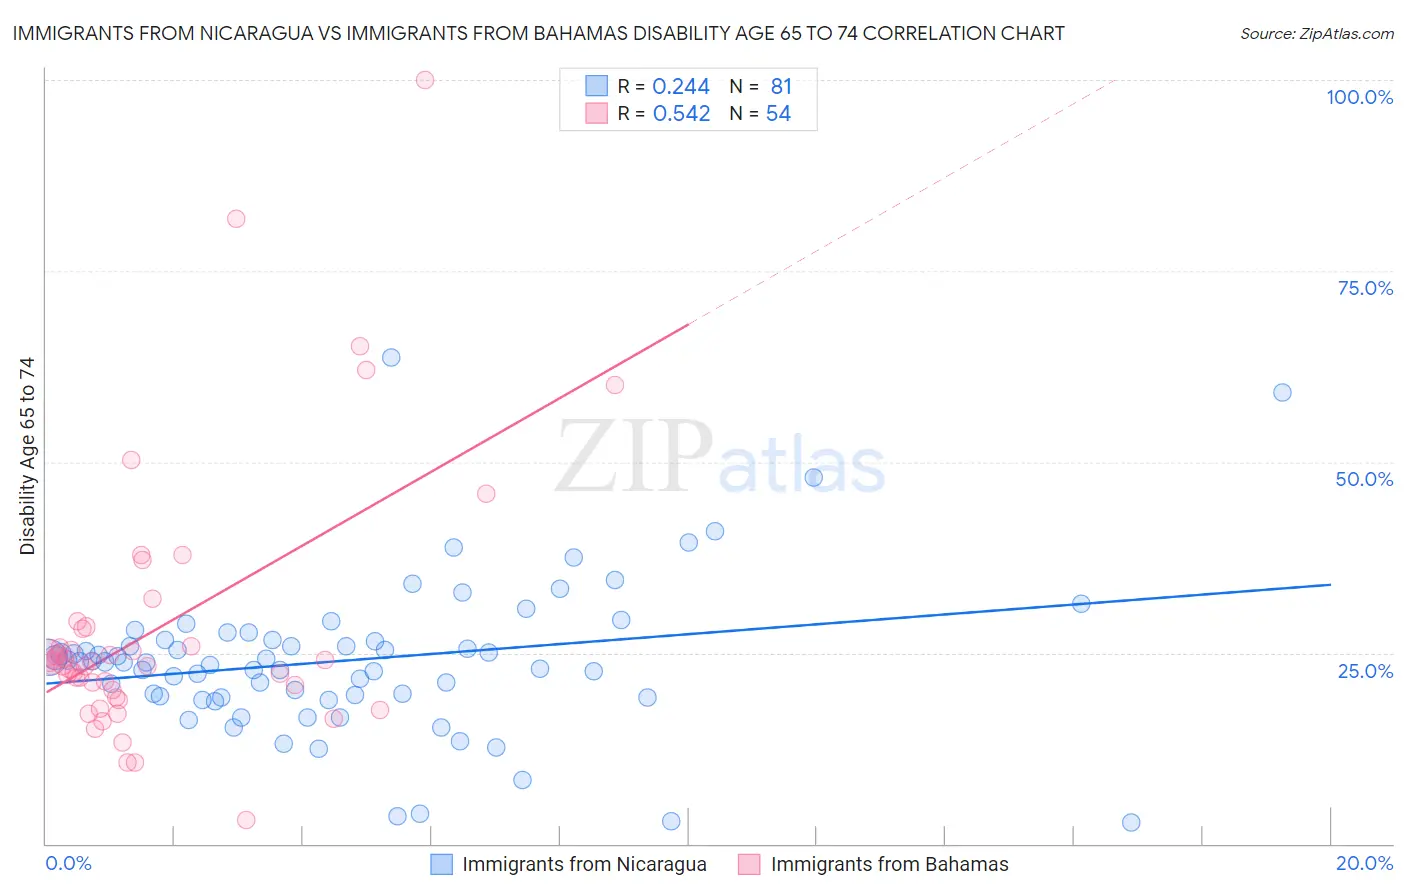
Immigrants from Nicaragua vs Immigrants from Bahamas Disability Age 65 to 74 Correlation Chart

The statistical analysis conducted on geographies consisting of 236,202,559 people shows a weak positive correlation between the proportion of Immigrants from Nicaragua and percentage of population with a disability between the ages 65 and 75 in the United States with a correlation coefficient (R) of 0.244 and weighted average of 24.1%. Similarly, the statistical analysis conducted on geographies consisting of 104,578,963 people shows a substantial positive correlation between the proportion of Immigrants from Bahamas and percentage of population with a disability between the ages 65 and 75 in the United States with a correlation coefficient (R) of 0.542 and weighted average of 23.7%, a difference of 1.5%.
Immigrants from Nicaragua vs Immigrants from Bahamas Disability Age 65 to 74

Disability Age 65 to 74 Correlation Summary

MeasurementImmigrants from NicaraguaImmigrants from Bahamas
Minimum2.9%3.1%
Maximum63.7%100.0%
Range60.9%96.9%
Mean24.0%28.1%
Median23.8%23.6%
Interquartile 25% (IQ1)19.3%20.1%
Interquartile 75% (IQ3)26.7%28.1%
Interquartile Range (IQR)7.5%7.9%
Standard Deviation (Sample)10.0%17.3%
Standard Deviation (Population)10.0%17.2%

Demographics Similar to Immigrants from Nicaragua and Immigrants from Bahamas by Disability Age 65 to 74

In terms of disability age 65 to 74, the demographic groups most similar to Immigrants from Nicaragua are Ghanaian (24.1%, a difference of 0.090%), Immigrants from Burma/Myanmar (24.0%, a difference of 0.27%), Immigrants from Nigeria (24.0%, a difference of 0.28%), Immigrants from Portugal (24.0%, a difference of 0.29%), and Jamaican (24.0%, a difference of 0.35%). Similarly, the demographic groups most similar to Immigrants from Bahamas are Kenyan (23.7%, a difference of 0.010%), Immigrants from Ecuador (23.7%, a difference of 0.040%), Immigrants from Grenada (23.8%, a difference of 0.11%), Tongan (23.8%, a difference of 0.22%), and Immigrants from Jamaica (23.8%, a difference of 0.22%).
DemographicsRating | RankDisability Age 65 to 74
Immigrants | Ecuador
23.9
/100
|
#201
Fair
23.7%
Immigrants | Bahamas
23.3
/100
|
#202
Fair
23.7%
Kenyans
23.2
/100
|
#203
Fair
23.7%
Immigrants | Grenada
22.1
/100
|
#204
Fair
23.8%
Tongans
20.8
/100
|
#205
Fair
23.8%
Immigrants | Jamaica
20.7
/100
|
#206
Fair
23.8%
Immigrants | Sudan
20.1
/100
|
#207
Fair
23.8%
Immigrants | Barbados
19.6
/100
|
#208
Poor
23.8%
Immigrants | Kenya
19.6
/100
|
#209
Poor
23.8%
Trinidadians and Tobagonians
16.4
/100
|
#210
Poor
23.9%
Immigrants | West Indies
15.9
/100
|
#211
Poor
23.9%
French
15.7
/100
|
#212
Poor
23.9%
Nicaraguans
14.3
/100
|
#213
Poor
23.9%
Immigrants | Oceania
13.6
/100
|
#214
Poor
24.0%
Pennsylvania Germans
13.3
/100
|
#215
Poor
24.0%
Jamaicans
12.2
/100
|
#216
Poor
24.0%
Immigrants | Portugal
11.7
/100
|
#217
Poor
24.0%
Immigrants | Nigeria
11.7
/100
|
#218
Poor
24.0%
Immigrants | Burma/Myanmar
11.6
/100
|
#219
Poor
24.0%
Ghanaians
10.4
/100
|
#220
Poor
24.1%
Immigrants | Nicaragua
9.8
/100
|
#221
Tragic
24.1%