Immigrants from Korea vs Immigrants from Bahamas Disability Age 65 to 74
COMPARE
Immigrants from Korea
Immigrants from Bahamas
Disability Age 65 to 74
Disability Age 65 to 74 Comparison
Immigrants from Korea
Immigrants from Bahamas
20.4%
DISABILITY AGE 65 TO 74
100.0/ 100
METRIC RATING
12th/ 347
METRIC RANK
23.7%
DISABILITY AGE 65 TO 74
23.3/ 100
METRIC RATING
202nd/ 347
METRIC RANK
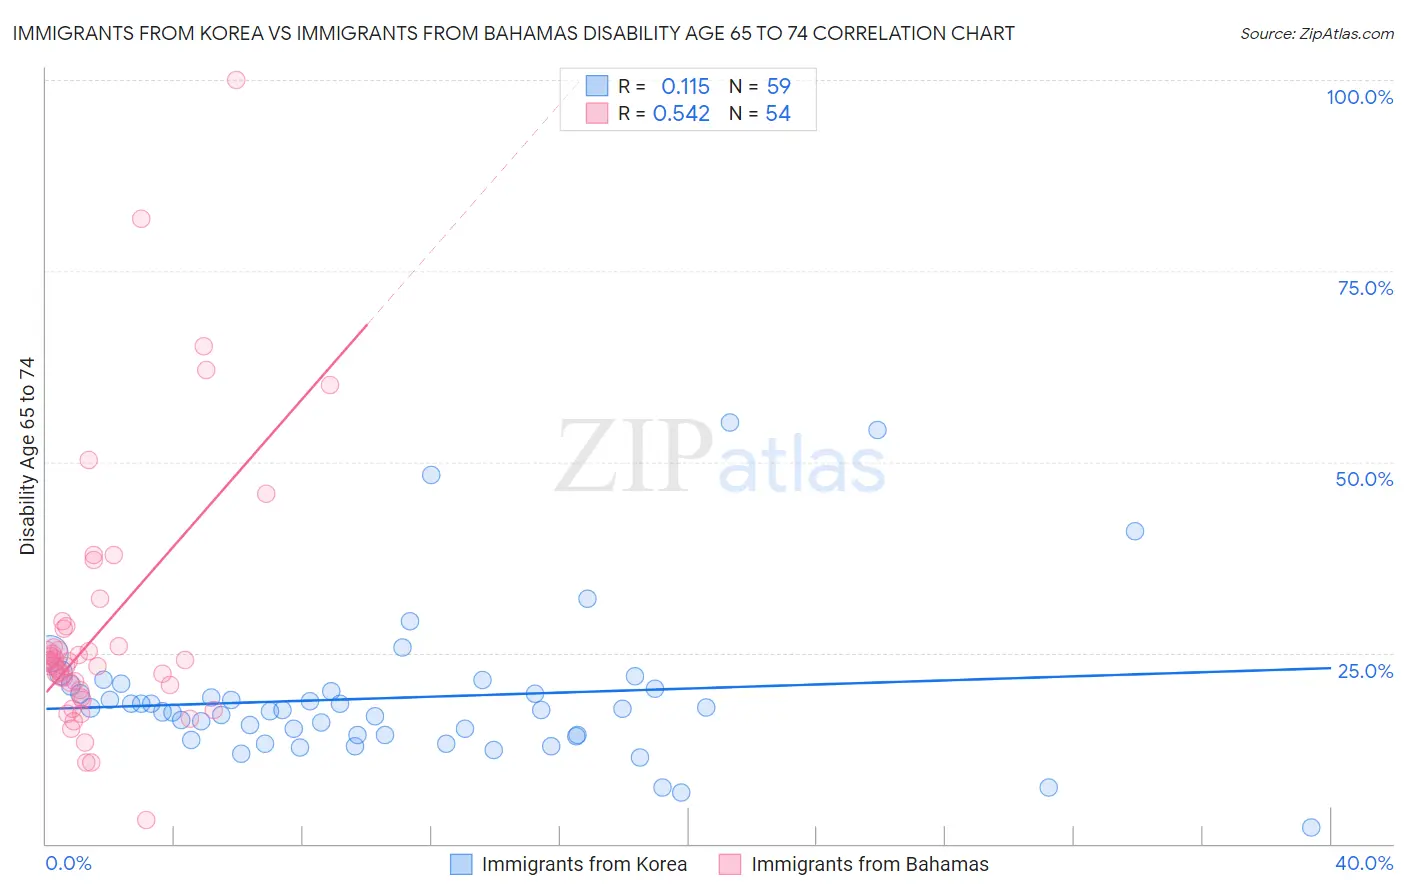
Immigrants from Korea vs Immigrants from Bahamas Disability Age 65 to 74 Correlation Chart
The statistical analysis conducted on geographies consisting of 415,254,221 people shows a poor positive correlation between the proportion of Immigrants from Korea and percentage of population with a disability between the ages 65 and 75 in the United States with a correlation coefficient (R) of 0.115 and weighted average of 20.4%. Similarly, the statistical analysis conducted on geographies consisting of 104,578,963 people shows a substantial positive correlation between the proportion of Immigrants from Bahamas and percentage of population with a disability between the ages 65 and 75 in the United States with a correlation coefficient (R) of 0.542 and weighted average of 23.7%, a difference of 16.6%.
Disability Age 65 to 74 Correlation Summary
| Measurement | Immigrants from Korea | Immigrants from Bahamas |
| Minimum | 2.2% | 3.1% |
| Maximum | 55.2% | 100.0% |
| Range | 53.1% | 96.9% |
| Mean | 19.1% | 28.1% |
| Median | 17.5% | 23.6% |
| Interquartile 25% (IQ1) | 14.2% | 20.1% |
| Interquartile 75% (IQ3) | 20.4% | 28.1% |
| Interquartile Range (IQR) | 6.2% | 7.9% |
| Standard Deviation (Sample) | 9.8% | 17.3% |
| Standard Deviation (Population) | 9.7% | 17.2% |
Similar Demographics by Disability Age 65 to 74
Demographics Similar to Immigrants from Korea by Disability Age 65 to 74
In terms of disability age 65 to 74, the demographic groups most similar to Immigrants from Korea are Immigrants from Ireland (20.3%, a difference of 0.21%), Immigrants from Eastern Asia (20.3%, a difference of 0.37%), Immigrants from Singapore (20.4%, a difference of 0.38%), Immigrants from China (20.3%, a difference of 0.45%), and Indian (Asian) (20.5%, a difference of 0.86%).
| Demographics | Rating | Rank | Disability Age 65 to 74 |
| Immigrants | Israel | 100.0 /100 | #5 | Exceptional 19.9% |
| Iranians | 100.0 /100 | #6 | Exceptional 19.9% |
| Cypriots | 100.0 /100 | #7 | Exceptional 20.1% |
| Thais | 100.0 /100 | #8 | Exceptional 20.1% |
| Immigrants | China | 100.0 /100 | #9 | Exceptional 20.3% |
| Immigrants | Eastern Asia | 100.0 /100 | #10 | Exceptional 20.3% |
| Immigrants | Ireland | 100.0 /100 | #11 | Exceptional 20.3% |
| Immigrants | Korea | 100.0 /100 | #12 | Exceptional 20.4% |
| Immigrants | Singapore | 100.0 /100 | #13 | Exceptional 20.4% |
| Indians (Asian) | 100.0 /100 | #14 | Exceptional 20.5% |
| Paraguayans | 100.0 /100 | #15 | Exceptional 20.5% |
| Immigrants | Lithuania | 100.0 /100 | #16 | Exceptional 20.5% |
| Immigrants | South Central Asia | 100.0 /100 | #17 | Exceptional 20.6% |
| Eastern Europeans | 100.0 /100 | #18 | Exceptional 20.6% |
| Burmese | 100.0 /100 | #19 | Exceptional 20.6% |
Demographics Similar to Immigrants from Bahamas by Disability Age 65 to 74
In terms of disability age 65 to 74, the demographic groups most similar to Immigrants from Bahamas are Kenyan (23.7%, a difference of 0.010%), Immigrants from Ecuador (23.7%, a difference of 0.040%), French Canadian (23.7%, a difference of 0.050%), Immigrants from Africa (23.7%, a difference of 0.080%), and Welsh (23.7%, a difference of 0.080%).
| Demographics | Rating | Rank | Disability Age 65 to 74 |
| Immigrants | St. Vincent and the Grenadines | 26.1 /100 | #195 | Fair 23.7% |
| Immigrants | Trinidad and Tobago | 26.1 /100 | #196 | Fair 23.7% |
| Immigrants | Immigrants | 25.8 /100 | #197 | Fair 23.7% |
| Immigrants | Africa | 24.4 /100 | #198 | Fair 23.7% |
| Welsh | 24.3 /100 | #199 | Fair 23.7% |
| French Canadians | 24.0 /100 | #200 | Fair 23.7% |
| Immigrants | Ecuador | 23.9 /100 | #201 | Fair 23.7% |
| Immigrants | Bahamas | 23.3 /100 | #202 | Fair 23.7% |
| Kenyans | 23.2 /100 | #203 | Fair 23.7% |
| Immigrants | Grenada | 22.1 /100 | #204 | Fair 23.8% |
| Tongans | 20.8 /100 | #205 | Fair 23.8% |
| Immigrants | Jamaica | 20.7 /100 | #206 | Fair 23.8% |
| Immigrants | Sudan | 20.1 /100 | #207 | Fair 23.8% |
| Immigrants | Barbados | 19.6 /100 | #208 | Poor 23.8% |
| Immigrants | Kenya | 19.6 /100 | #209 | Poor 23.8% |