Immigrants from China vs Swedish 4th Grade
COMPARE
Immigrants from China
Swedish
4th Grade
4th Grade Comparison
Immigrants from China
Swedes
97.0%
4TH GRADE
0.3/ 100
METRIC RATING
266th/ 347
METRIC RANK
98.4%
4TH GRADE
100.0/ 100
METRIC RATING
13th/ 347
METRIC RANK
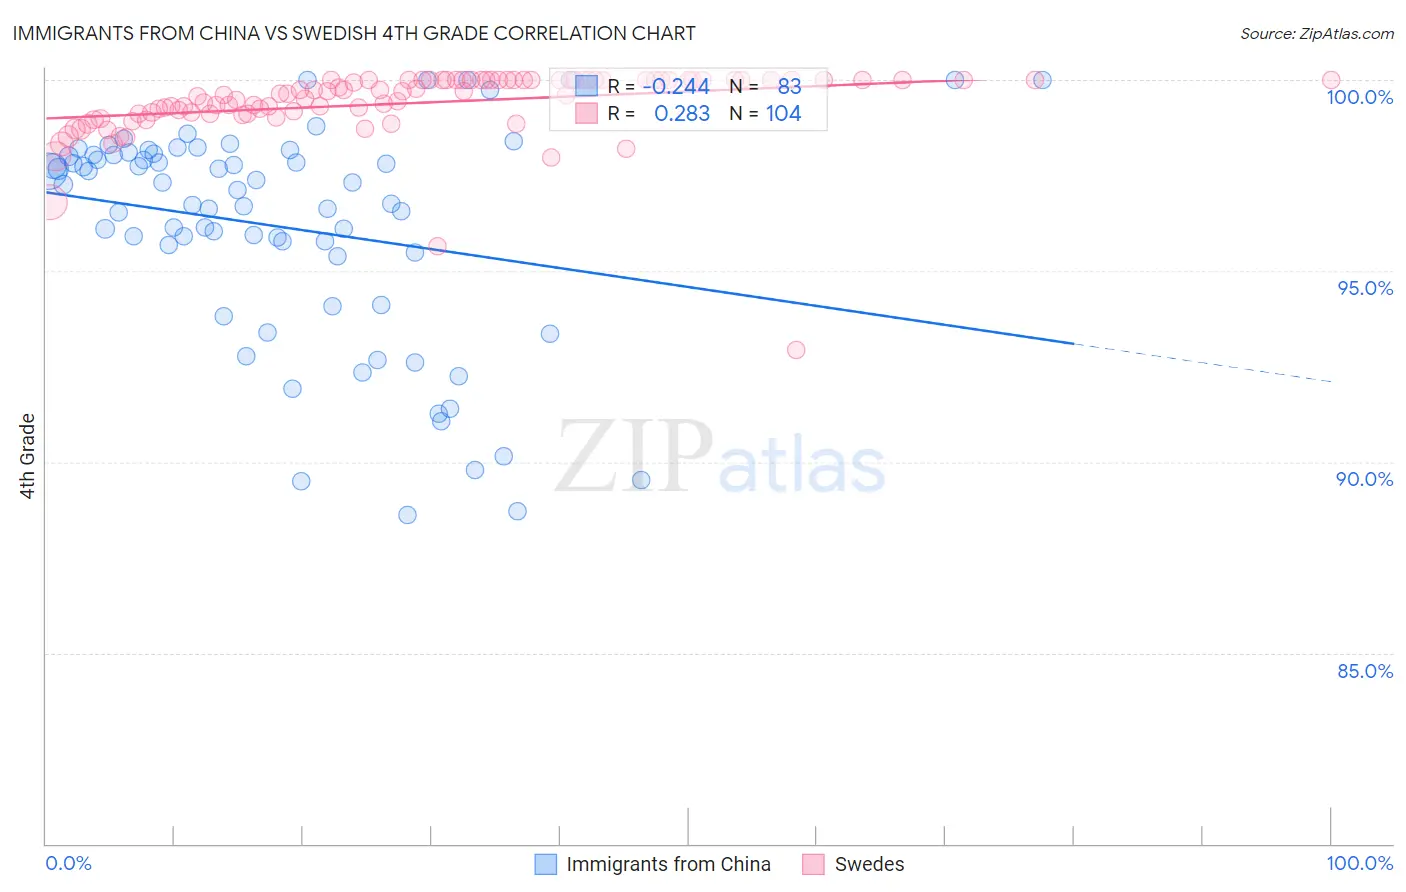
Immigrants from China vs Swedish 4th Grade Correlation Chart
The statistical analysis conducted on geographies consisting of 457,082,957 people shows a weak negative correlation between the proportion of Immigrants from China and percentage of population with at least 4th grade education in the United States with a correlation coefficient (R) of -0.244 and weighted average of 97.0%. Similarly, the statistical analysis conducted on geographies consisting of 539,231,492 people shows a weak positive correlation between the proportion of Swedes and percentage of population with at least 4th grade education in the United States with a correlation coefficient (R) of 0.283 and weighted average of 98.4%, a difference of 1.5%.
4th Grade Correlation Summary
| Measurement | Immigrants from China | Swedish |
| Minimum | 88.6% | 92.9% |
| Maximum | 100.0% | 100.0% |
| Range | 11.4% | 7.1% |
| Mean | 96.1% | 99.4% |
| Median | 97.1% | 99.7% |
| Interquartile 25% (IQ1) | 95.4% | 99.1% |
| Interquartile 75% (IQ3) | 98.0% | 100.0% |
| Interquartile Range (IQR) | 2.7% | 0.87% |
| Standard Deviation (Sample) | 2.9% | 0.95% |
| Standard Deviation (Population) | 2.9% | 0.95% |
Similar Demographics by 4th Grade
Demographics Similar to Immigrants from China by 4th Grade
In terms of 4th grade, the demographic groups most similar to Immigrants from China are Immigrants from Nigeria (97.0%, a difference of 0.0%), Taiwanese (97.0%, a difference of 0.010%), Armenian (97.0%, a difference of 0.010%), Ghanaian (97.0%, a difference of 0.010%), and Immigrants from Jamaica (97.0%, a difference of 0.020%).
| Demographics | Rating | Rank | 4th Grade |
| Immigrants | Ethiopia | 0.4 /100 | #259 | Tragic 97.0% |
| Immigrants | Sierra Leone | 0.4 /100 | #260 | Tragic 97.0% |
| Immigrants | South America | 0.4 /100 | #261 | Tragic 97.0% |
| West Indians | 0.4 /100 | #262 | Tragic 97.0% |
| Immigrants | Jamaica | 0.3 /100 | #263 | Tragic 97.0% |
| Taiwanese | 0.3 /100 | #264 | Tragic 97.0% |
| Armenians | 0.3 /100 | #265 | Tragic 97.0% |
| Immigrants | China | 0.3 /100 | #266 | Tragic 97.0% |
| Immigrants | Nigeria | 0.3 /100 | #267 | Tragic 97.0% |
| Ghanaians | 0.2 /100 | #268 | Tragic 97.0% |
| Immigrants | Uzbekistan | 0.2 /100 | #269 | Tragic 96.9% |
| Cubans | 0.2 /100 | #270 | Tragic 96.9% |
| Immigrants | Peru | 0.1 /100 | #271 | Tragic 96.9% |
| Fijians | 0.1 /100 | #272 | Tragic 96.9% |
| Immigrants | Cameroon | 0.1 /100 | #273 | Tragic 96.9% |
Demographics Similar to Swedes by 4th Grade
In terms of 4th grade, the demographic groups most similar to Swedes are English (98.4%, a difference of 0.0%), Tlingit-Haida (98.4%, a difference of 0.0%), Alaskan Athabascan (98.4%, a difference of 0.010%), Carpatho Rusyn (98.4%, a difference of 0.010%), and Slovene (98.4%, a difference of 0.030%).
| Demographics | Rating | Rank | 4th Grade |
| Norwegians | 100.0 /100 | #6 | Exceptional 98.5% |
| Slovaks | 100.0 /100 | #7 | Exceptional 98.5% |
| Germans | 100.0 /100 | #8 | Exceptional 98.5% |
| Slovenes | 100.0 /100 | #9 | Exceptional 98.4% |
| Alaskan Athabascans | 100.0 /100 | #10 | Exceptional 98.4% |
| English | 100.0 /100 | #11 | Exceptional 98.4% |
| Tlingit-Haida | 100.0 /100 | #12 | Exceptional 98.4% |
| Swedes | 100.0 /100 | #13 | Exceptional 98.4% |
| Carpatho Rusyns | 100.0 /100 | #14 | Exceptional 98.4% |
| Dutch | 100.0 /100 | #15 | Exceptional 98.4% |
| Scottish | 100.0 /100 | #16 | Exceptional 98.4% |
| Pennsylvania Germans | 100.0 /100 | #17 | Exceptional 98.4% |
| Poles | 100.0 /100 | #18 | Exceptional 98.4% |
| Irish | 100.0 /100 | #19 | Exceptional 98.4% |
| Alaska Natives | 100.0 /100 | #20 | Exceptional 98.4% |