Immigrants from Saudi Arabia vs Immigrants from Argentina Self-Care Disability
COMPARE
Immigrants from Saudi Arabia
Immigrants from Argentina
Self-Care Disability
Self-Care Disability Comparison
Immigrants from Saudi Arabia
Immigrants from Argentina
2.2%
SELF-CARE DISABILITY
100.0/ 100
METRIC RATING
17th/ 347
METRIC RANK
2.3%
SELF-CARE DISABILITY
99.3/ 100
METRIC RATING
66th/ 347
METRIC RANK
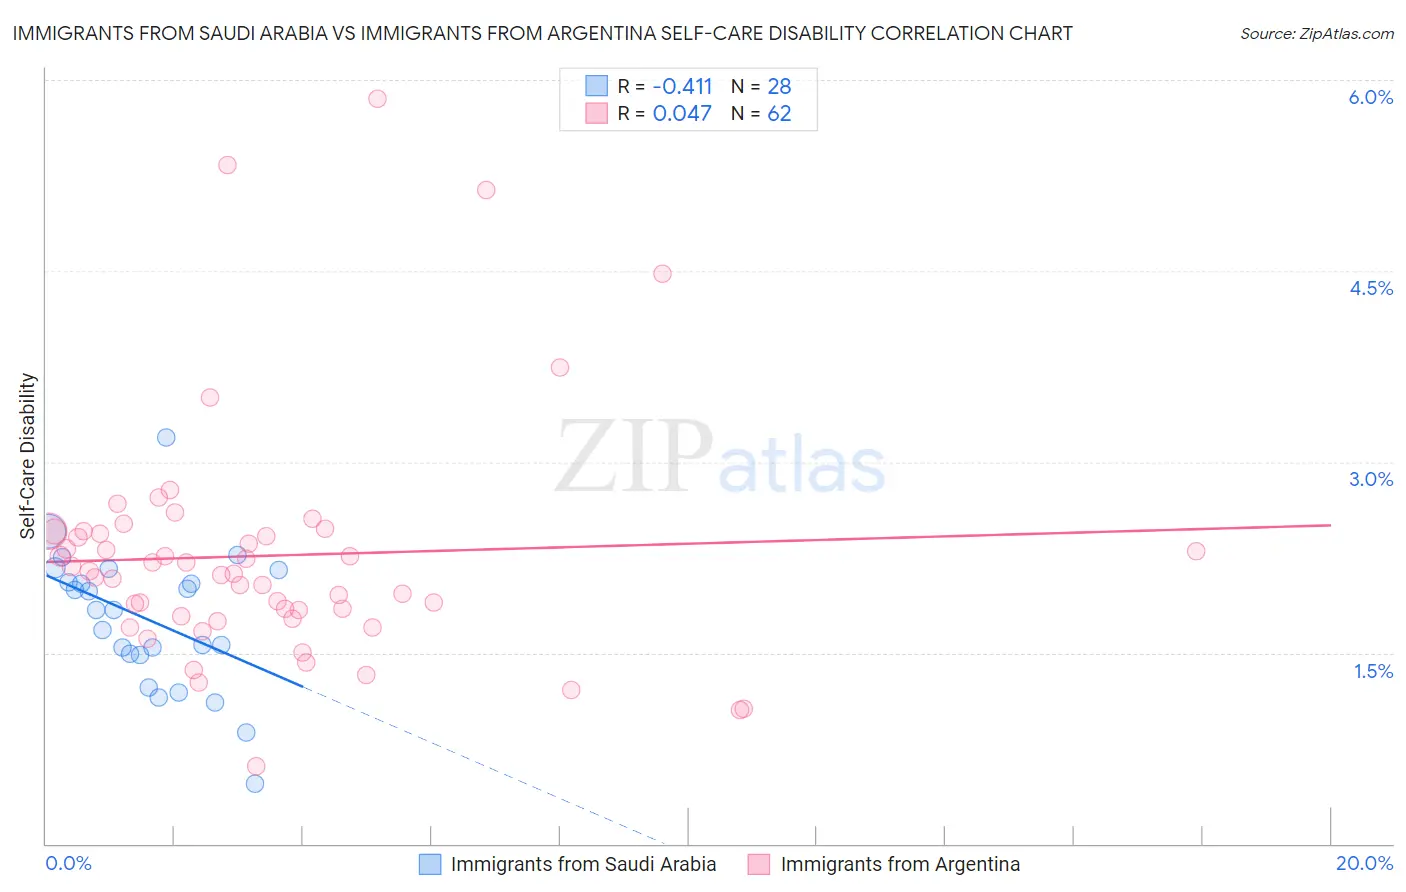
Immigrants from Saudi Arabia vs Immigrants from Argentina Self-Care Disability Correlation Chart
The statistical analysis conducted on geographies consisting of 164,197,287 people shows a moderate negative correlation between the proportion of Immigrants from Saudi Arabia and percentage of population with self-care disability in the United States with a correlation coefficient (R) of -0.411 and weighted average of 2.2%. Similarly, the statistical analysis conducted on geographies consisting of 264,279,860 people shows no correlation between the proportion of Immigrants from Argentina and percentage of population with self-care disability in the United States with a correlation coefficient (R) of 0.047 and weighted average of 2.3%, a difference of 5.1%.
Self-Care Disability Correlation Summary
| Measurement | Immigrants from Saudi Arabia | Immigrants from Argentina |
| Minimum | 0.47% | 0.61% |
| Maximum | 3.2% | 5.8% |
| Range | 2.7% | 5.2% |
| Mean | 1.8% | 2.3% |
| Median | 1.8% | 2.1% |
| Interquartile 25% (IQ1) | 1.5% | 1.8% |
| Interquartile 75% (IQ3) | 2.1% | 2.5% |
| Interquartile Range (IQR) | 0.62% | 0.66% |
| Standard Deviation (Sample) | 0.55% | 0.95% |
| Standard Deviation (Population) | 0.54% | 0.94% |
Similar Demographics by Self-Care Disability
Demographics Similar to Immigrants from Saudi Arabia by Self-Care Disability
In terms of self-care disability, the demographic groups most similar to Immigrants from Saudi Arabia are Immigrants from Kuwait (2.2%, a difference of 0.16%), Immigrants from Taiwan (2.2%, a difference of 0.25%), Okinawan (2.2%, a difference of 0.44%), Luxembourger (2.2%, a difference of 0.45%), and Immigrants from Eritrea (2.2%, a difference of 0.59%).
| Demographics | Rating | Rank | Self-Care Disability |
| Sudanese | 100.0 /100 | #10 | Exceptional 2.2% |
| Immigrants | South Central Asia | 100.0 /100 | #11 | Exceptional 2.2% |
| Immigrants | Ethiopia | 100.0 /100 | #12 | Exceptional 2.2% |
| Ethiopians | 100.0 /100 | #13 | Exceptional 2.2% |
| Luxembourgers | 100.0 /100 | #14 | Exceptional 2.2% |
| Okinawans | 100.0 /100 | #15 | Exceptional 2.2% |
| Immigrants | Kuwait | 100.0 /100 | #16 | Exceptional 2.2% |
| Immigrants | Saudi Arabia | 100.0 /100 | #17 | Exceptional 2.2% |
| Immigrants | Taiwan | 100.0 /100 | #18 | Exceptional 2.2% |
| Immigrants | Eritrea | 100.0 /100 | #19 | Exceptional 2.2% |
| Tongans | 100.0 /100 | #20 | Exceptional 2.2% |
| Bulgarians | 100.0 /100 | #21 | Exceptional 2.2% |
| Immigrants | Venezuela | 100.0 /100 | #22 | Exceptional 2.2% |
| Cambodians | 100.0 /100 | #23 | Exceptional 2.2% |
| Cypriots | 100.0 /100 | #24 | Exceptional 2.2% |
Demographics Similar to Immigrants from Argentina by Self-Care Disability
In terms of self-care disability, the demographic groups most similar to Immigrants from Argentina are Brazilian (2.3%, a difference of 0.030%), South African (2.3%, a difference of 0.030%), Swedish (2.3%, a difference of 0.090%), Mongolian (2.3%, a difference of 0.10%), and Immigrants from Zaire (2.3%, a difference of 0.12%).
| Demographics | Rating | Rank | Self-Care Disability |
| New Zealanders | 99.5 /100 | #59 | Exceptional 2.3% |
| Immigrants | Japan | 99.5 /100 | #60 | Exceptional 2.3% |
| Palestinians | 99.4 /100 | #61 | Exceptional 2.3% |
| Egyptians | 99.4 /100 | #62 | Exceptional 2.3% |
| Mongolians | 99.3 /100 | #63 | Exceptional 2.3% |
| Swedes | 99.3 /100 | #64 | Exceptional 2.3% |
| Brazilians | 99.3 /100 | #65 | Exceptional 2.3% |
| Immigrants | Argentina | 99.3 /100 | #66 | Exceptional 2.3% |
| South Africans | 99.3 /100 | #67 | Exceptional 2.3% |
| Immigrants | Zaire | 99.2 /100 | #68 | Exceptional 2.3% |
| Immigrants | Norway | 99.2 /100 | #69 | Exceptional 2.3% |
| Immigrants | Northern Europe | 99.2 /100 | #70 | Exceptional 2.3% |
| Asians | 99.2 /100 | #71 | Exceptional 2.3% |
| Eastern Europeans | 99.2 /100 | #72 | Exceptional 2.3% |
| Immigrants | Egypt | 99.1 /100 | #73 | Exceptional 2.3% |