Immigrants from Cambodia vs Immigrants from Russia Male Disability
COMPARE
Immigrants from Cambodia
Immigrants from Russia
Male Disability
Male Disability Comparison
Immigrants from Cambodia
Immigrants from Russia
11.5%
MALE DISABILITY
10.8/ 100
METRIC RATING
204th/ 347
METRIC RANK
10.6%
MALE DISABILITY
98.6/ 100
METRIC RATING
78th/ 347
METRIC RANK
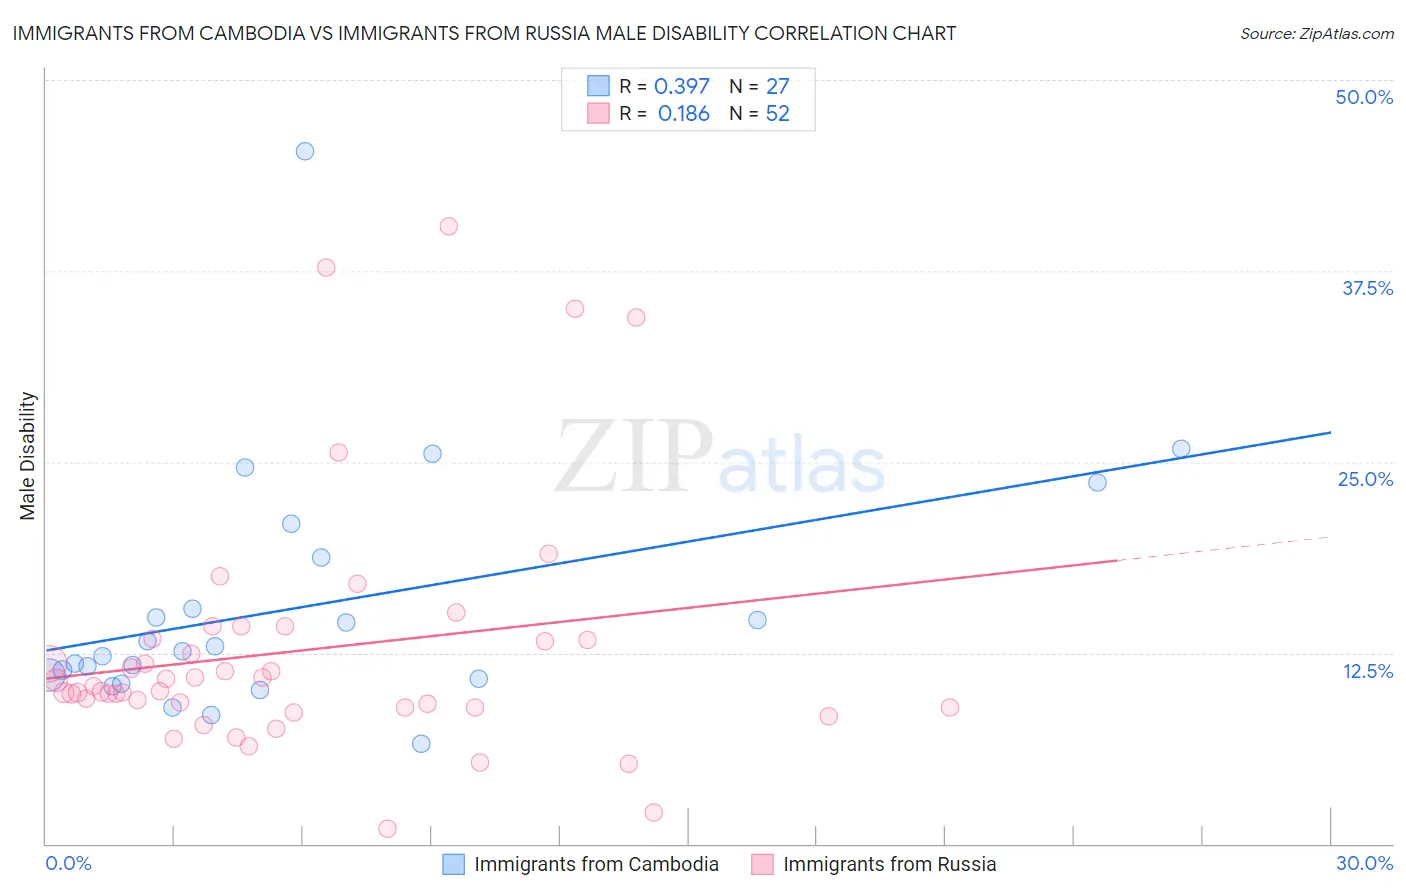
Immigrants from Cambodia vs Immigrants from Russia Male Disability Correlation Chart
The statistical analysis conducted on geographies consisting of 205,155,985 people shows a mild positive correlation between the proportion of Immigrants from Cambodia and percentage of males with a disability in the United States with a correlation coefficient (R) of 0.397 and weighted average of 11.5%. Similarly, the statistical analysis conducted on geographies consisting of 347,901,203 people shows a poor positive correlation between the proportion of Immigrants from Russia and percentage of males with a disability in the United States with a correlation coefficient (R) of 0.186 and weighted average of 10.6%, a difference of 9.4%.
Male Disability Correlation Summary
| Measurement | Immigrants from Cambodia | Immigrants from Russia |
| Minimum | 6.5% | 0.96% |
| Maximum | 45.3% | 40.4% |
| Range | 38.8% | 39.4% |
| Mean | 15.5% | 12.6% |
| Median | 12.6% | 10.2% |
| Interquartile 25% (IQ1) | 10.8% | 9.0% |
| Interquartile 75% (IQ3) | 18.7% | 13.4% |
| Interquartile Range (IQR) | 7.9% | 4.4% |
| Standard Deviation (Sample) | 8.0% | 8.1% |
| Standard Deviation (Population) | 7.9% | 8.0% |
Similar Demographics by Male Disability
Demographics Similar to Immigrants from Cambodia by Male Disability
In terms of male disability, the demographic groups most similar to Immigrants from Cambodia are Serbian (11.5%, a difference of 0.0%), Jamaican (11.5%, a difference of 0.010%), Ukrainian (11.5%, a difference of 0.010%), Immigrants from Somalia (11.5%, a difference of 0.050%), and Icelander (11.6%, a difference of 0.090%).
| Demographics | Rating | Rank | Male Disability |
| Somalis | 18.2 /100 | #197 | Poor 11.4% |
| Immigrants | Jamaica | 16.3 /100 | #198 | Poor 11.5% |
| Lebanese | 15.4 /100 | #199 | Poor 11.5% |
| Immigrants | Iraq | 13.0 /100 | #200 | Poor 11.5% |
| Immigrants | Panama | 13.0 /100 | #201 | Poor 11.5% |
| Immigrants | Mexico | 12.6 /100 | #202 | Poor 11.5% |
| Jamaicans | 10.9 /100 | #203 | Poor 11.5% |
| Immigrants | Cambodia | 10.8 /100 | #204 | Poor 11.5% |
| Serbians | 10.7 /100 | #205 | Poor 11.5% |
| Ukrainians | 10.6 /100 | #206 | Poor 11.5% |
| Immigrants | Somalia | 10.4 /100 | #207 | Poor 11.5% |
| Icelanders | 10.1 /100 | #208 | Poor 11.6% |
| Spanish American Indians | 10.1 /100 | #209 | Poor 11.6% |
| Ute | 9.4 /100 | #210 | Tragic 11.6% |
| Immigrants | Thailand | 8.4 /100 | #211 | Tragic 11.6% |
Demographics Similar to Immigrants from Russia by Male Disability
In terms of male disability, the demographic groups most similar to Immigrants from Russia are Laotian (10.6%, a difference of 0.020%), Immigrants from Sierra Leone (10.5%, a difference of 0.080%), Sierra Leonean (10.5%, a difference of 0.12%), Zimbabwean (10.6%, a difference of 0.23%), and Immigrants from Lebanon (10.5%, a difference of 0.24%).
| Demographics | Rating | Rank | Male Disability |
| Immigrants | Cameroon | 99.0 /100 | #71 | Exceptional 10.5% |
| Immigrants | Serbia | 99.0 /100 | #72 | Exceptional 10.5% |
| Immigrants | Lithuania | 98.9 /100 | #73 | Exceptional 10.5% |
| Immigrants | Lebanon | 98.8 /100 | #74 | Exceptional 10.5% |
| Sierra Leoneans | 98.7 /100 | #75 | Exceptional 10.5% |
| Immigrants | Sierra Leone | 98.7 /100 | #76 | Exceptional 10.5% |
| Laotians | 98.6 /100 | #77 | Exceptional 10.6% |
| Immigrants | Russia | 98.6 /100 | #78 | Exceptional 10.6% |
| Zimbabweans | 98.4 /100 | #79 | Exceptional 10.6% |
| Immigrants | Jordan | 98.4 /100 | #80 | Exceptional 10.6% |
| Immigrants | Chile | 98.3 /100 | #81 | Exceptional 10.6% |
| Immigrants | Guyana | 98.2 /100 | #82 | Exceptional 10.6% |
| Immigrants | Poland | 98.1 /100 | #83 | Exceptional 10.6% |
| Bulgarians | 98.1 /100 | #84 | Exceptional 10.6% |
| Sri Lankans | 97.9 /100 | #85 | Exceptional 10.6% |