French American Indian vs Yugoslavian Female Disability
COMPARE
French American Indian
Yugoslavian
Female Disability
Female Disability Comparison
French American Indians
Yugoslavians
13.7%
FEMALE DISABILITY
0.0/ 100
METRIC RATING
309th/ 347
METRIC RANK
12.6%
FEMALE DISABILITY
3.7/ 100
METRIC RATING
238th/ 347
METRIC RANK
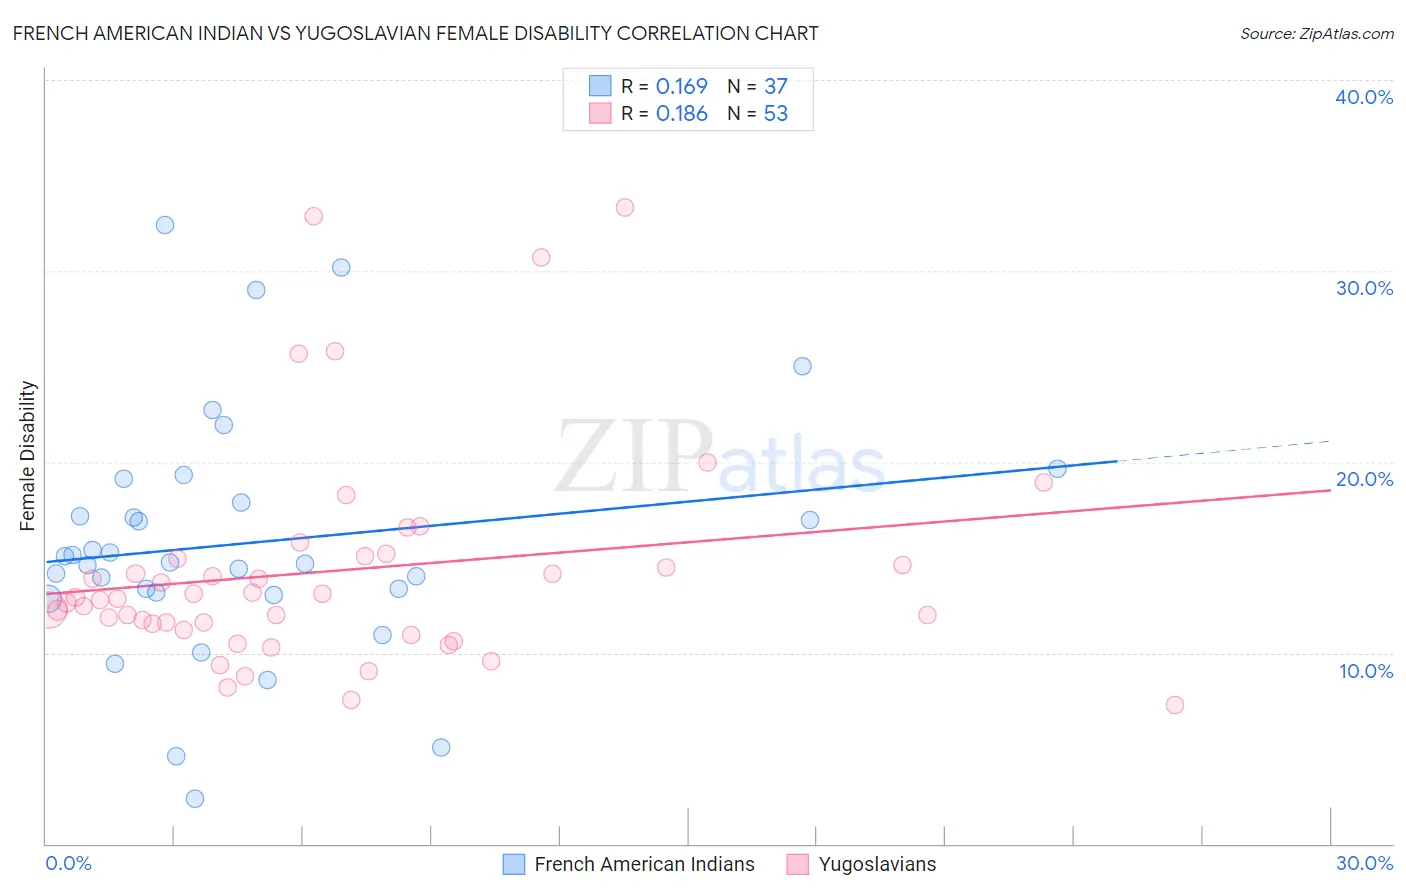
French American Indian vs Yugoslavian Female Disability Correlation Chart
The statistical analysis conducted on geographies consisting of 131,961,738 people shows a poor positive correlation between the proportion of French American Indians and percentage of females with a disability in the United States with a correlation coefficient (R) of 0.169 and weighted average of 13.7%. Similarly, the statistical analysis conducted on geographies consisting of 285,691,291 people shows a poor positive correlation between the proportion of Yugoslavians and percentage of females with a disability in the United States with a correlation coefficient (R) of 0.186 and weighted average of 12.6%, a difference of 8.9%.
Female Disability Correlation Summary
| Measurement | French American Indian | Yugoslavian |
| Minimum | 2.3% | 7.3% |
| Maximum | 32.4% | 33.3% |
| Range | 30.1% | 26.1% |
| Mean | 15.8% | 14.3% |
| Median | 14.8% | 12.9% |
| Interquartile 25% (IQ1) | 13.1% | 11.4% |
| Interquartile 75% (IQ3) | 18.5% | 15.0% |
| Interquartile Range (IQR) | 5.4% | 3.6% |
| Standard Deviation (Sample) | 6.5% | 5.7% |
| Standard Deviation (Population) | 6.4% | 5.7% |
Similar Demographics by Female Disability
Demographics Similar to French American Indians by Female Disability
In terms of female disability, the demographic groups most similar to French American Indians are Cree (13.7%, a difference of 0.060%), Apache (13.7%, a difference of 0.12%), Hopi (13.7%, a difference of 0.41%), Central American Indian (13.6%, a difference of 0.52%), and Delaware (13.8%, a difference of 0.72%).
| Demographics | Rating | Rank | Female Disability |
| Scotch-Irish | 0.0 /100 | #302 | Tragic 13.4% |
| Immigrants | Portugal | 0.0 /100 | #303 | Tragic 13.5% |
| Immigrants | Micronesia | 0.0 /100 | #304 | Tragic 13.5% |
| Dominicans | 0.0 /100 | #305 | Tragic 13.5% |
| French Canadians | 0.0 /100 | #306 | Tragic 13.6% |
| Central American Indians | 0.0 /100 | #307 | Tragic 13.6% |
| Cree | 0.0 /100 | #308 | Tragic 13.7% |
| French American Indians | 0.0 /100 | #309 | Tragic 13.7% |
| Apache | 0.0 /100 | #310 | Tragic 13.7% |
| Hopi | 0.0 /100 | #311 | Tragic 13.7% |
| Delaware | 0.0 /100 | #312 | Tragic 13.8% |
| Blackfeet | 0.0 /100 | #313 | Tragic 13.8% |
| Puget Sound Salish | 0.0 /100 | #314 | Tragic 13.8% |
| Alaskan Athabascans | 0.0 /100 | #315 | Tragic 13.9% |
| Spanish Americans | 0.0 /100 | #316 | Tragic 14.0% |
Demographics Similar to Yugoslavians by Female Disability
In terms of female disability, the demographic groups most similar to Yugoslavians are Slavic (12.6%, a difference of 0.030%), Barbadian (12.6%, a difference of 0.030%), German Russian (12.6%, a difference of 0.13%), Immigrants from West Indies (12.6%, a difference of 0.15%), and Malaysian (12.5%, a difference of 0.28%).
| Demographics | Rating | Rank | Female Disability |
| Belgians | 6.5 /100 | #231 | Tragic 12.5% |
| Immigrants | Somalia | 5.9 /100 | #232 | Tragic 12.5% |
| Immigrants | Iraq | 5.3 /100 | #233 | Tragic 12.5% |
| Scandinavians | 5.3 /100 | #234 | Tragic 12.5% |
| Malaysians | 5.0 /100 | #235 | Tragic 12.5% |
| Immigrants | West Indies | 4.4 /100 | #236 | Tragic 12.6% |
| Slavs | 3.8 /100 | #237 | Tragic 12.6% |
| Yugoslavians | 3.7 /100 | #238 | Tragic 12.6% |
| Barbadians | 3.6 /100 | #239 | Tragic 12.6% |
| German Russians | 3.2 /100 | #240 | Tragic 12.6% |
| Japanese | 2.7 /100 | #241 | Tragic 12.6% |
| Canadians | 2.6 /100 | #242 | Tragic 12.6% |
| Immigrants | Senegal | 2.5 /100 | #243 | Tragic 12.6% |
| Alsatians | 2.5 /100 | #244 | Tragic 12.6% |
| Immigrants | Jamaica | 2.2 /100 | #245 | Tragic 12.6% |