Immigrants from Brazil vs Armenian Cognitive Disability
COMPARE
Immigrants from Brazil
Armenian
Cognitive Disability
Cognitive Disability Comparison
Immigrants from Brazil
Armenians
17.0%
COGNITIVE DISABILITY
89.3/ 100
METRIC RATING
144th/ 347
METRIC RANK
17.2%
COGNITIVE DISABILITY
70.1/ 100
METRIC RATING
164th/ 347
METRIC RANK
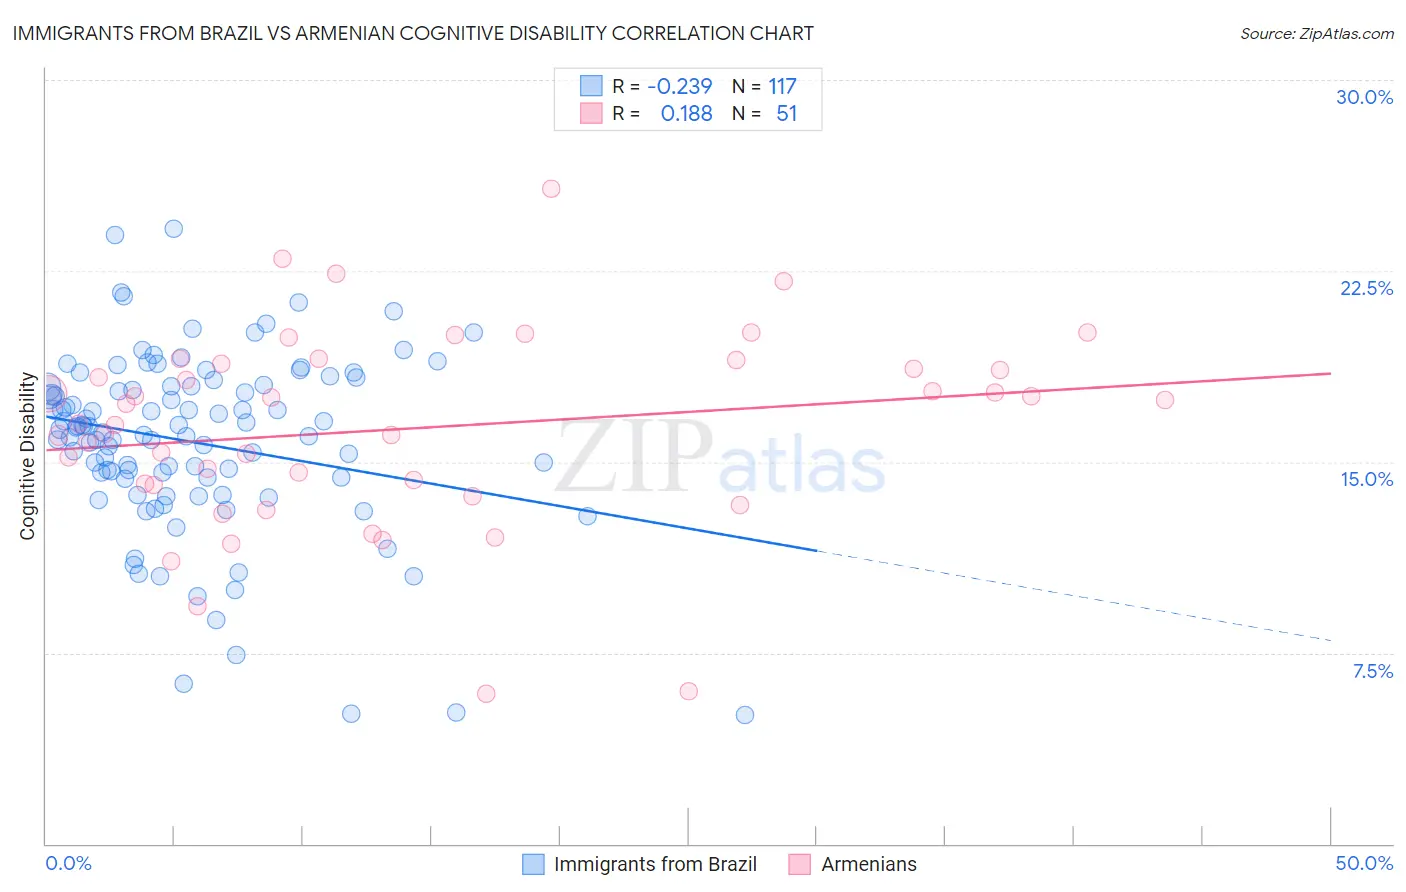
Immigrants from Brazil vs Armenian Cognitive Disability Correlation Chart
The statistical analysis conducted on geographies consisting of 343,010,044 people shows a weak negative correlation between the proportion of Immigrants from Brazil and percentage of population with cognitive disability in the United States with a correlation coefficient (R) of -0.239 and weighted average of 17.0%. Similarly, the statistical analysis conducted on geographies consisting of 310,934,651 people shows a poor positive correlation between the proportion of Armenians and percentage of population with cognitive disability in the United States with a correlation coefficient (R) of 0.188 and weighted average of 17.2%, a difference of 0.92%.
Cognitive Disability Correlation Summary
| Measurement | Immigrants from Brazil | Armenian |
| Minimum | 5.1% | 5.9% |
| Maximum | 24.2% | 25.7% |
| Range | 19.1% | 19.9% |
| Mean | 15.8% | 16.3% |
| Median | 16.3% | 16.5% |
| Interquartile 25% (IQ1) | 14.4% | 14.1% |
| Interquartile 75% (IQ3) | 18.0% | 18.8% |
| Interquartile Range (IQR) | 3.6% | 4.8% |
| Standard Deviation (Sample) | 3.5% | 3.9% |
| Standard Deviation (Population) | 3.5% | 3.9% |
Demographics Similar to Immigrants from Brazil and Armenians by Cognitive Disability
In terms of cognitive disability, the demographic groups most similar to Immigrants from Brazil are Immigrants from South Eastern Asia (17.0%, a difference of 0.050%), Costa Rican (17.0%, a difference of 0.10%), Scotch-Irish (17.1%, a difference of 0.23%), French Canadian (17.1%, a difference of 0.24%), and Cypriot (17.1%, a difference of 0.24%). Similarly, the demographic groups most similar to Armenians are Yugoslavian (17.2%, a difference of 0.050%), Immigrants from Switzerland (17.2%, a difference of 0.050%), American (17.2%, a difference of 0.070%), Australian (17.2%, a difference of 0.080%), and Immigrants from Latvia (17.2%, a difference of 0.11%).
| Demographics | Rating | Rank | Cognitive Disability |
| Immigrants | Brazil | 89.3 /100 | #144 | Excellent 17.0% |
| Immigrants | South Eastern Asia | 88.7 /100 | #145 | Excellent 17.0% |
| Costa Ricans | 88.0 /100 | #146 | Excellent 17.0% |
| Scotch-Irish | 85.9 /100 | #147 | Excellent 17.1% |
| French Canadians | 85.7 /100 | #148 | Excellent 17.1% |
| Cypriots | 85.7 /100 | #149 | Excellent 17.1% |
| Basques | 85.5 /100 | #150 | Excellent 17.1% |
| Syrians | 83.0 /100 | #151 | Excellent 17.1% |
| Immigrants | Indonesia | 82.7 /100 | #152 | Excellent 17.1% |
| Immigrants | Kazakhstan | 80.5 /100 | #153 | Excellent 17.1% |
| Immigrants | Malaysia | 79.3 /100 | #154 | Good 17.1% |
| Brazilians | 78.9 /100 | #155 | Good 17.1% |
| Sri Lankans | 78.9 /100 | #156 | Good 17.1% |
| Immigrants | Australia | 76.0 /100 | #157 | Good 17.1% |
| Celtics | 74.1 /100 | #158 | Good 17.1% |
| Immigrants | Latvia | 73.2 /100 | #159 | Good 17.2% |
| Australians | 72.4 /100 | #160 | Good 17.2% |
| Americans | 72.2 /100 | #161 | Good 17.2% |
| Yugoslavians | 71.6 /100 | #162 | Good 17.2% |
| Immigrants | Switzerland | 71.5 /100 | #163 | Good 17.2% |
| Armenians | 70.1 /100 | #164 | Good 17.2% |