Immigrants from Bosnia and Herzegovina vs Native Hawaiian Disability Age 35 to 64
COMPARE
Immigrants from Bosnia and Herzegovina
Native Hawaiian
Disability Age 35 to 64
Disability Age 35 to 64 Comparison
Immigrants from Bosnia and Herzegovina
Native Hawaiians
11.4%
DISABILITY AGE 35 TO 64
35.2/ 100
METRIC RATING
187th/ 347
METRIC RANK
11.7%
DISABILITY AGE 35 TO 64
14.8/ 100
METRIC RATING
206th/ 347
METRIC RANK
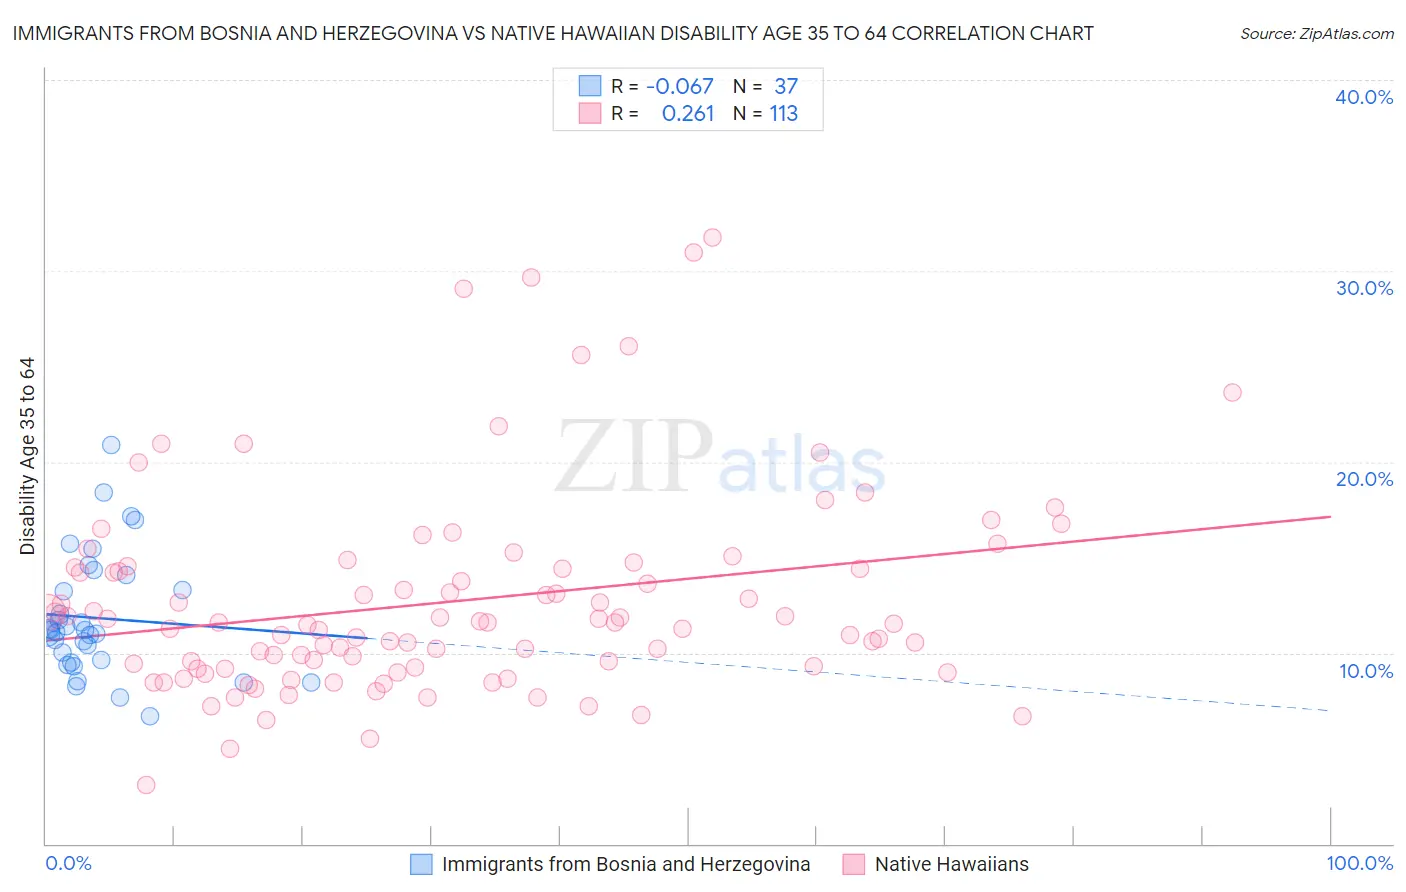
Immigrants from Bosnia and Herzegovina vs Native Hawaiian Disability Age 35 to 64 Correlation Chart
The statistical analysis conducted on geographies consisting of 156,799,711 people shows a slight negative correlation between the proportion of Immigrants from Bosnia and Herzegovina and percentage of population with a disability between the ages 34 and 64 in the United States with a correlation coefficient (R) of -0.067 and weighted average of 11.4%. Similarly, the statistical analysis conducted on geographies consisting of 331,809,234 people shows a weak positive correlation between the proportion of Native Hawaiians and percentage of population with a disability between the ages 34 and 64 in the United States with a correlation coefficient (R) of 0.261 and weighted average of 11.7%, a difference of 2.2%.
Disability Age 35 to 64 Correlation Summary
| Measurement | Immigrants from Bosnia and Herzegovina | Native Hawaiian |
| Minimum | 6.7% | 3.1% |
| Maximum | 20.9% | 31.7% |
| Range | 14.2% | 28.6% |
| Mean | 11.8% | 12.7% |
| Median | 11.2% | 11.6% |
| Interquartile 25% (IQ1) | 9.6% | 9.2% |
| Interquartile 75% (IQ3) | 13.7% | 14.4% |
| Interquartile Range (IQR) | 4.1% | 5.2% |
| Standard Deviation (Sample) | 3.1% | 5.3% |
| Standard Deviation (Population) | 3.1% | 5.3% |
Demographics Similar to Immigrants from Bosnia and Herzegovina and Native Hawaiians by Disability Age 35 to 64
In terms of disability age 35 to 64, the demographic groups most similar to Immigrants from Bosnia and Herzegovina are Northern European (11.4%, a difference of 0.020%), Hungarian (11.4%, a difference of 0.050%), Slovene (11.4%, a difference of 0.13%), Immigrants from Nigeria (11.4%, a difference of 0.24%), and Swedish (11.4%, a difference of 0.34%). Similarly, the demographic groups most similar to Native Hawaiians are Slavic (11.7%, a difference of 0.10%), Nigerian (11.6%, a difference of 0.21%), British (11.6%, a difference of 0.32%), Immigrants from Guatemala (11.6%, a difference of 0.39%), and Immigrants from Kenya (11.6%, a difference of 0.41%).
| Demographics | Rating | Rank | Disability Age 35 to 64 |
| Slovenes | 36.6 /100 | #186 | Fair 11.4% |
| Immigrants | Bosnia and Herzegovina | 35.2 /100 | #187 | Fair 11.4% |
| Northern Europeans | 34.9 /100 | #188 | Fair 11.4% |
| Hungarians | 34.6 /100 | #189 | Fair 11.4% |
| Immigrants | Nigeria | 32.5 /100 | #190 | Fair 11.4% |
| Swedes | 31.3 /100 | #191 | Fair 11.4% |
| Norwegians | 29.7 /100 | #192 | Fair 11.5% |
| Immigrants | Africa | 29.0 /100 | #193 | Fair 11.5% |
| Immigrants | Latin America | 27.5 /100 | #194 | Fair 11.5% |
| Carpatho Rusyns | 25.3 /100 | #195 | Fair 11.5% |
| Iraqis | 24.2 /100 | #196 | Fair 11.5% |
| Immigrants | Iraq | 21.0 /100 | #197 | Fair 11.6% |
| Immigrants | Panama | 20.4 /100 | #198 | Fair 11.6% |
| Basques | 19.5 /100 | #199 | Poor 11.6% |
| Swiss | 18.7 /100 | #200 | Poor 11.6% |
| Immigrants | Kenya | 17.7 /100 | #201 | Poor 11.6% |
| Immigrants | Guatemala | 17.5 /100 | #202 | Poor 11.6% |
| British | 17.0 /100 | #203 | Poor 11.6% |
| Nigerians | 16.3 /100 | #204 | Poor 11.6% |
| Slavs | 15.5 /100 | #205 | Poor 11.7% |
| Native Hawaiians | 14.8 /100 | #206 | Poor 11.7% |