Immigrants from Bolivia vs Immigrants from Honduras Female Disability
COMPARE
Immigrants from Bolivia
Immigrants from Honduras
Female Disability
Female Disability Comparison
Immigrants from Bolivia
Immigrants from Honduras
10.3%
FEMALE DISABILITY
100.0/ 100
METRIC RATING
5th/ 347
METRIC RANK
12.3%
FEMALE DISABILITY
31.3/ 100
METRIC RATING
190th/ 347
METRIC RANK
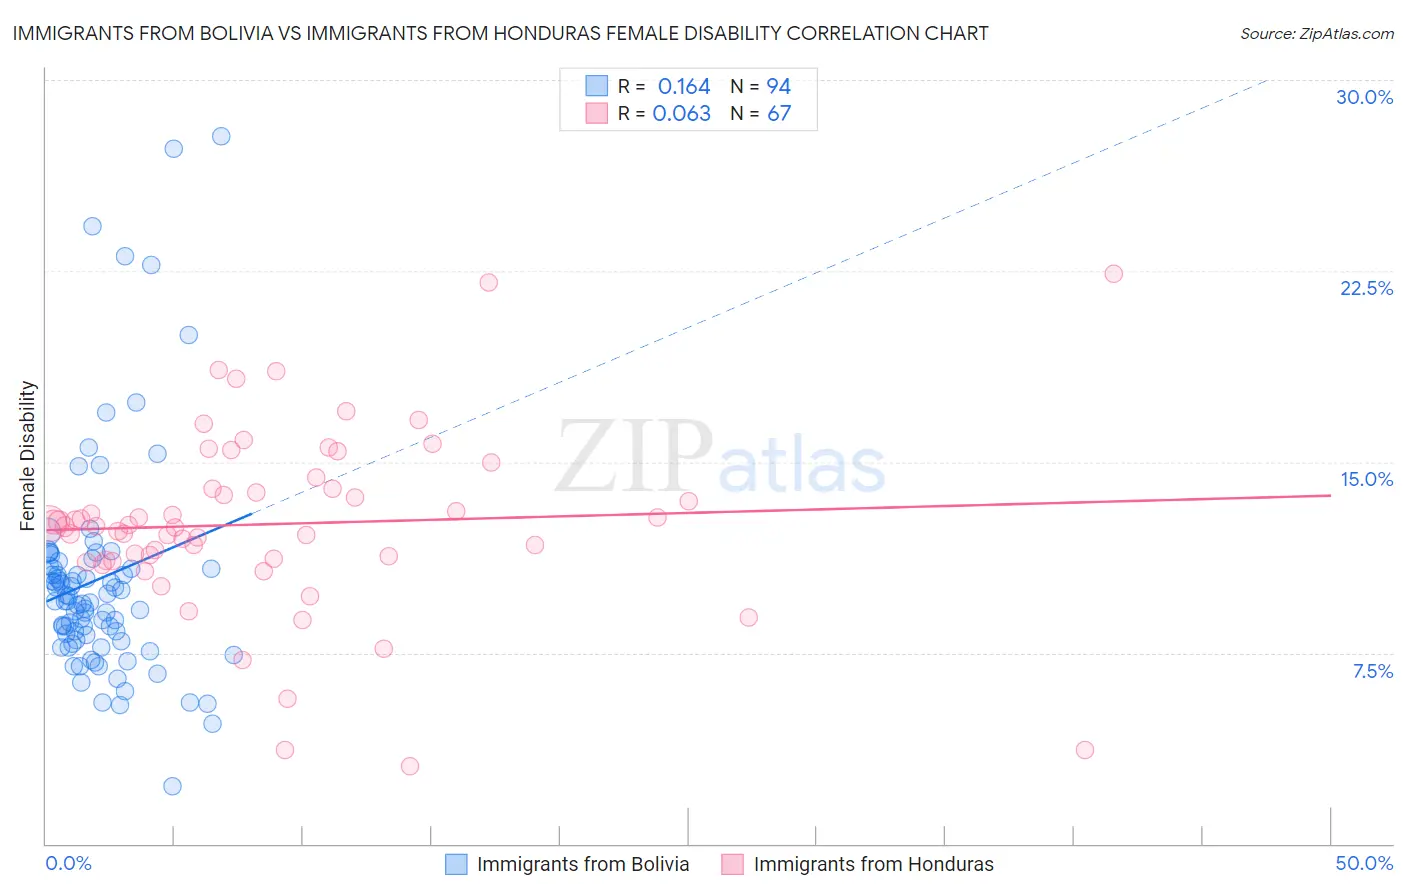
Immigrants from Bolivia vs Immigrants from Honduras Female Disability Correlation Chart
The statistical analysis conducted on geographies consisting of 158,717,377 people shows a poor positive correlation between the proportion of Immigrants from Bolivia and percentage of females with a disability in the United States with a correlation coefficient (R) of 0.164 and weighted average of 10.3%. Similarly, the statistical analysis conducted on geographies consisting of 322,542,549 people shows a slight positive correlation between the proportion of Immigrants from Honduras and percentage of females with a disability in the United States with a correlation coefficient (R) of 0.063 and weighted average of 12.3%, a difference of 19.8%.
Female Disability Correlation Summary
| Measurement | Immigrants from Bolivia | Immigrants from Honduras |
| Minimum | 2.3% | 3.1% |
| Maximum | 27.8% | 22.4% |
| Range | 25.5% | 19.4% |
| Mean | 10.4% | 12.6% |
| Median | 9.5% | 12.5% |
| Interquartile 25% (IQ1) | 8.0% | 11.1% |
| Interquartile 75% (IQ3) | 10.9% | 14.0% |
| Interquartile Range (IQR) | 2.9% | 2.8% |
| Standard Deviation (Sample) | 4.4% | 3.6% |
| Standard Deviation (Population) | 4.4% | 3.6% |
Similar Demographics by Female Disability
Demographics Similar to Immigrants from Bolivia by Female Disability
In terms of female disability, the demographic groups most similar to Immigrants from Bolivia are Thai (10.2%, a difference of 0.82%), Bolivian (10.4%, a difference of 0.91%), Immigrants from Singapore (10.4%, a difference of 1.7%), Immigrants from Taiwan (10.1%, a difference of 1.7%), and Immigrants from South Central Asia (10.5%, a difference of 1.9%).
| Demographics | Rating | Rank | Female Disability |
| Immigrants | India | 100.0 /100 | #1 | Exceptional 10.0% |
| Filipinos | 100.0 /100 | #2 | Exceptional 10.1% |
| Immigrants | Taiwan | 100.0 /100 | #3 | Exceptional 10.1% |
| Thais | 100.0 /100 | #4 | Exceptional 10.2% |
| Immigrants | Bolivia | 100.0 /100 | #5 | Exceptional 10.3% |
| Bolivians | 100.0 /100 | #6 | Exceptional 10.4% |
| Immigrants | Singapore | 100.0 /100 | #7 | Exceptional 10.4% |
| Immigrants | South Central Asia | 100.0 /100 | #8 | Exceptional 10.5% |
| Iranians | 100.0 /100 | #9 | Exceptional 10.6% |
| Immigrants | Hong Kong | 100.0 /100 | #10 | Exceptional 10.6% |
| Immigrants | Korea | 100.0 /100 | #11 | Exceptional 10.6% |
| Immigrants | Israel | 100.0 /100 | #12 | Exceptional 10.7% |
| Immigrants | Eastern Asia | 100.0 /100 | #13 | Exceptional 10.7% |
| Immigrants | China | 100.0 /100 | #14 | Exceptional 10.7% |
| Burmese | 100.0 /100 | #15 | Exceptional 10.7% |
Demographics Similar to Immigrants from Honduras by Female Disability
In terms of female disability, the demographic groups most similar to Immigrants from Honduras are Immigrants from Albania (12.3%, a difference of 0.010%), Immigrants from North America (12.3%, a difference of 0.060%), Armenian (12.3%, a difference of 0.070%), Serbian (12.3%, a difference of 0.080%), and Austrian (12.3%, a difference of 0.090%).
| Demographics | Rating | Rank | Female Disability |
| Cubans | 36.5 /100 | #183 | Fair 12.3% |
| Iraqis | 36.0 /100 | #184 | Fair 12.3% |
| Immigrants | Uzbekistan | 33.9 /100 | #185 | Fair 12.3% |
| Austrians | 33.3 /100 | #186 | Fair 12.3% |
| Serbians | 33.1 /100 | #187 | Fair 12.3% |
| Immigrants | North America | 32.8 /100 | #188 | Fair 12.3% |
| Immigrants | Albania | 31.6 /100 | #189 | Fair 12.3% |
| Immigrants | Honduras | 31.3 /100 | #190 | Fair 12.3% |
| Armenians | 29.7 /100 | #191 | Fair 12.3% |
| Immigrants | Western Africa | 29.2 /100 | #192 | Fair 12.3% |
| Northern Europeans | 27.5 /100 | #193 | Fair 12.3% |
| Ukrainians | 27.2 /100 | #194 | Fair 12.3% |
| Swedes | 26.6 /100 | #195 | Fair 12.3% |
| Immigrants | Panama | 25.5 /100 | #196 | Fair 12.3% |
| Hondurans | 25.4 /100 | #197 | Fair 12.3% |