Immigrants from Bolivia vs Lumbee Unemployment
COMPARE
Immigrants from Bolivia
Lumbee
Unemployment
Unemployment Comparison
Immigrants from Bolivia
Lumbee
4.8%
UNEMPLOYMENT
99.8/ 100
METRIC RATING
34th/ 347
METRIC RANK
6.4%
UNEMPLOYMENT
0.0/ 100
METRIC RATING
306th/ 347
METRIC RANK
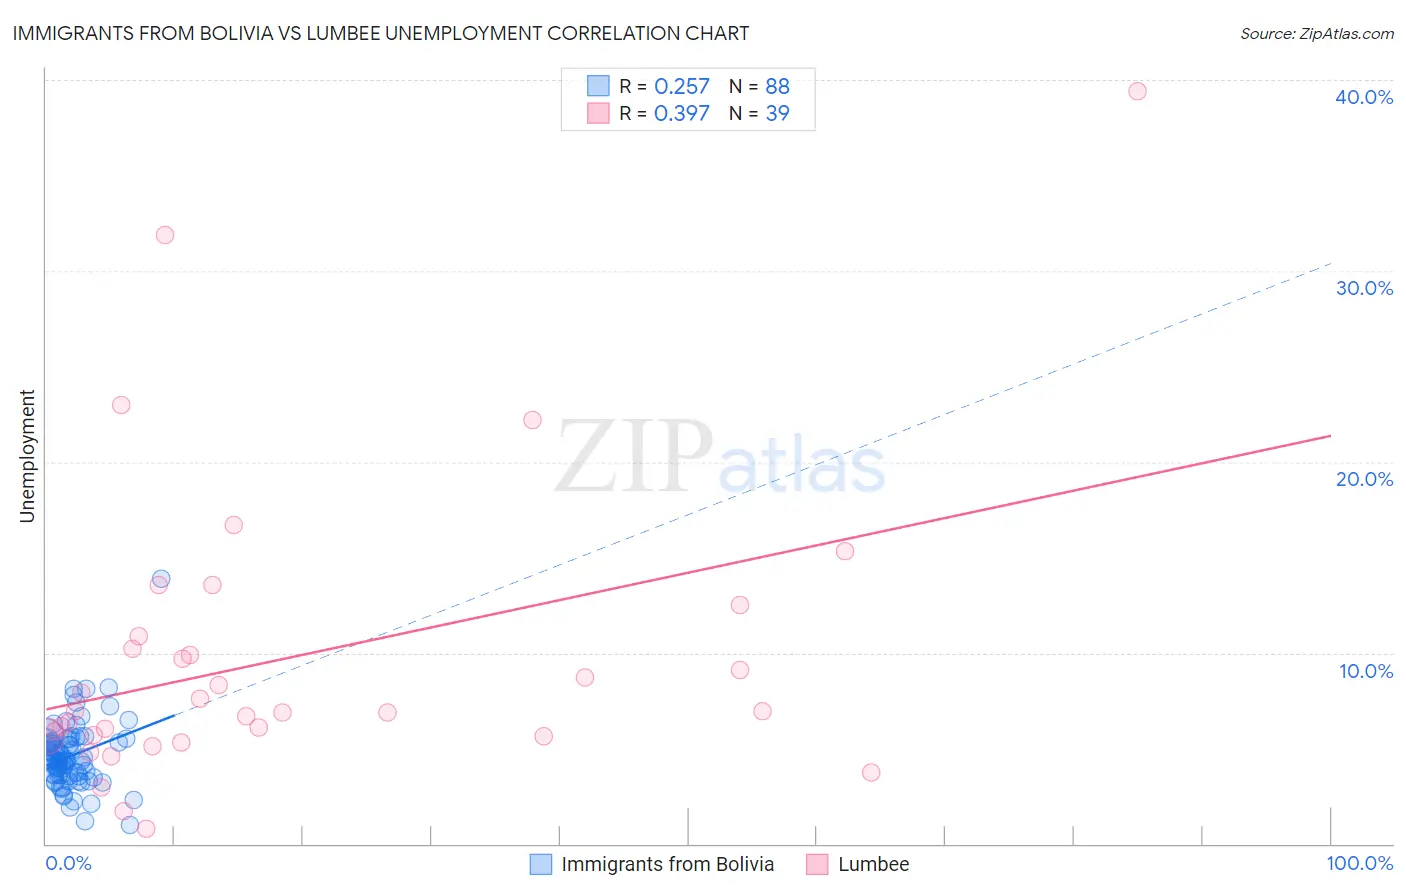
Immigrants from Bolivia vs Lumbee Unemployment Correlation Chart
The statistical analysis conducted on geographies consisting of 158,688,461 people shows a weak positive correlation between the proportion of Immigrants from Bolivia and unemployment in the United States with a correlation coefficient (R) of 0.257 and weighted average of 4.8%. Similarly, the statistical analysis conducted on geographies consisting of 92,248,032 people shows a mild positive correlation between the proportion of Lumbee and unemployment in the United States with a correlation coefficient (R) of 0.397 and weighted average of 6.4%, a difference of 35.2%.
Unemployment Correlation Summary
| Measurement | Immigrants from Bolivia | Lumbee |
| Minimum | 1.0% | 0.80% |
| Maximum | 13.9% | 39.4% |
| Range | 12.9% | 38.6% |
| Mean | 4.6% | 9.8% |
| Median | 4.4% | 6.9% |
| Interquartile 25% (IQ1) | 3.6% | 5.6% |
| Interquartile 75% (IQ3) | 5.3% | 10.9% |
| Interquartile Range (IQR) | 1.7% | 5.2% |
| Standard Deviation (Sample) | 1.8% | 7.8% |
| Standard Deviation (Population) | 1.8% | 7.7% |
Similar Demographics by Unemployment
Demographics Similar to Immigrants from Bolivia by Unemployment
In terms of unemployment, the demographic groups most similar to Immigrants from Bolivia are Sudanese (4.8%, a difference of 0.040%), Zimbabwean (4.8%, a difference of 0.050%), Scotch-Irish (4.8%, a difference of 0.070%), Croatian (4.8%, a difference of 0.15%), and Irish (4.8%, a difference of 0.17%).
| Demographics | Rating | Rank | Unemployment |
| Finns | 99.9 /100 | #27 | Exceptional 4.7% |
| Cubans | 99.8 /100 | #28 | Exceptional 4.7% |
| Poles | 99.8 /100 | #29 | Exceptional 4.7% |
| Irish | 99.8 /100 | #30 | Exceptional 4.8% |
| Croatians | 99.8 /100 | #31 | Exceptional 4.8% |
| Zimbabweans | 99.8 /100 | #32 | Exceptional 4.8% |
| Sudanese | 99.8 /100 | #33 | Exceptional 4.8% |
| Immigrants | Bolivia | 99.8 /100 | #34 | Exceptional 4.8% |
| Scotch-Irish | 99.8 /100 | #35 | Exceptional 4.8% |
| Tongans | 99.7 /100 | #36 | Exceptional 4.8% |
| Czechoslovakians | 99.7 /100 | #37 | Exceptional 4.8% |
| Bolivians | 99.7 /100 | #38 | Exceptional 4.8% |
| Lithuanians | 99.7 /100 | #39 | Exceptional 4.8% |
| Northern Europeans | 99.7 /100 | #40 | Exceptional 4.8% |
| Immigrants | Bosnia and Herzegovina | 99.7 /100 | #41 | Exceptional 4.8% |
Demographics Similar to Lumbee by Unemployment
In terms of unemployment, the demographic groups most similar to Lumbee are Menominee (6.4%, a difference of 0.030%), Immigrants from Jamaica (6.4%, a difference of 0.29%), Immigrants from Bangladesh (6.5%, a difference of 0.48%), Barbadian (6.5%, a difference of 0.86%), and Vietnamese (6.5%, a difference of 0.87%).
| Demographics | Rating | Rank | Unemployment |
| Immigrants | West Indies | 0.0 /100 | #299 | Tragic 6.3% |
| Immigrants | Trinidad and Tobago | 0.0 /100 | #300 | Tragic 6.3% |
| Trinidadians and Tobagonians | 0.0 /100 | #301 | Tragic 6.3% |
| West Indians | 0.0 /100 | #302 | Tragic 6.4% |
| Belizeans | 0.0 /100 | #303 | Tragic 6.4% |
| Immigrants | Jamaica | 0.0 /100 | #304 | Tragic 6.4% |
| Menominee | 0.0 /100 | #305 | Tragic 6.4% |
| Lumbee | 0.0 /100 | #306 | Tragic 6.4% |
| Immigrants | Bangladesh | 0.0 /100 | #307 | Tragic 6.5% |
| Barbadians | 0.0 /100 | #308 | Tragic 6.5% |
| Vietnamese | 0.0 /100 | #309 | Tragic 6.5% |
| Immigrants | Belize | 0.0 /100 | #310 | Tragic 6.5% |
| Cape Verdeans | 0.0 /100 | #311 | Tragic 6.5% |
| Colville | 0.0 /100 | #312 | Tragic 6.6% |
| Immigrants | Barbados | 0.0 /100 | #313 | Tragic 6.6% |