Immigrants from Belgium vs Icelander Hearing Disability
COMPARE
Immigrants from Belgium
Icelander
Hearing Disability
Hearing Disability Comparison
Immigrants from Belgium
Icelanders
3.0%
HEARING DISABILITY
41.5/ 100
METRIC RATING
181st/ 347
METRIC RANK
3.2%
HEARING DISABILITY
5.2/ 100
METRIC RATING
224th/ 347
METRIC RANK
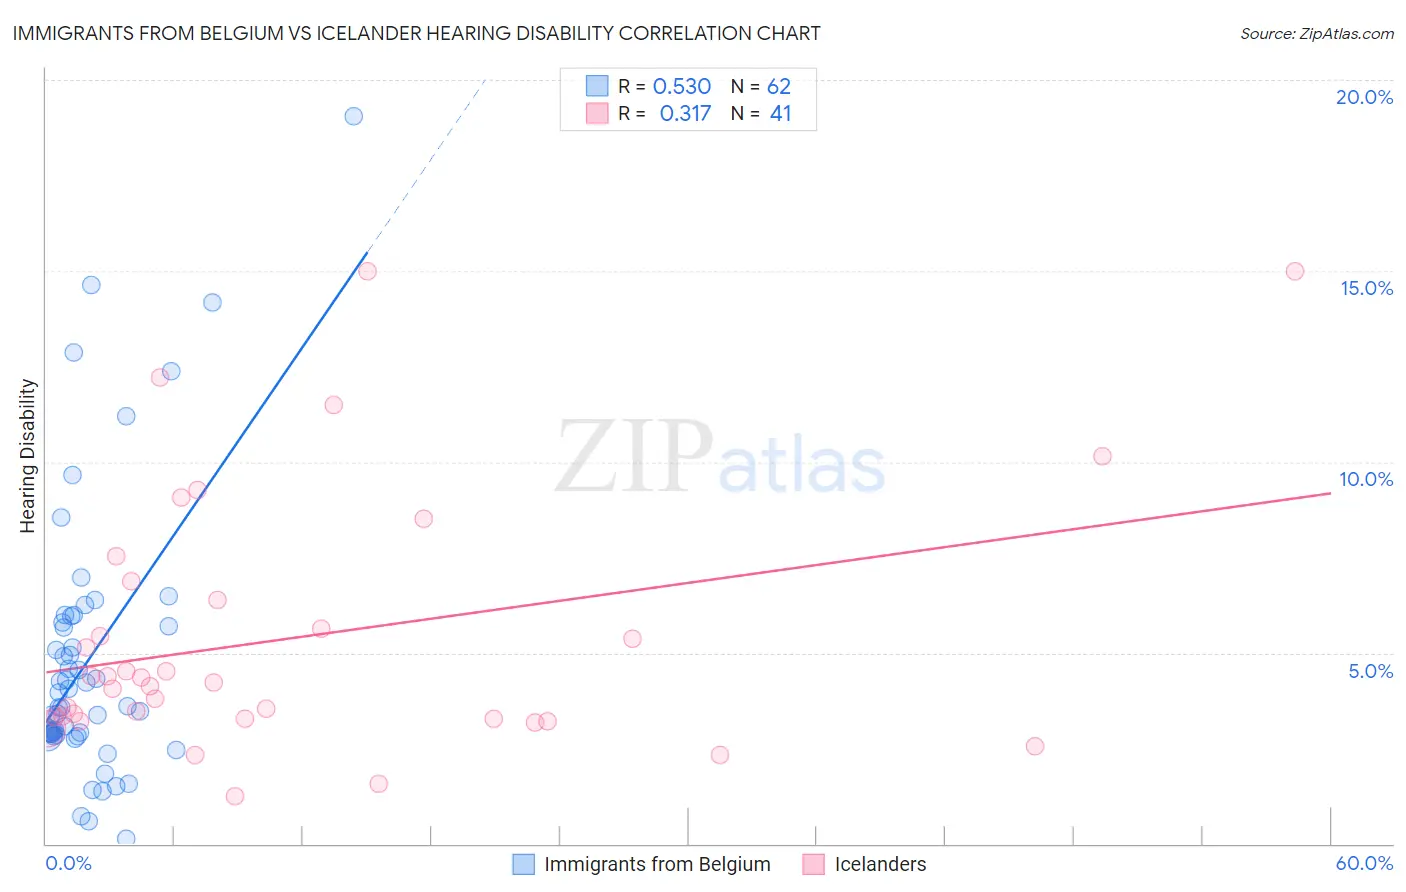
Immigrants from Belgium vs Icelander Hearing Disability Correlation Chart
The statistical analysis conducted on geographies consisting of 146,709,031 people shows a substantial positive correlation between the proportion of Immigrants from Belgium and percentage of population with hearing disability in the United States with a correlation coefficient (R) of 0.530 and weighted average of 3.0%. Similarly, the statistical analysis conducted on geographies consisting of 159,637,999 people shows a mild positive correlation between the proportion of Icelanders and percentage of population with hearing disability in the United States with a correlation coefficient (R) of 0.317 and weighted average of 3.2%, a difference of 5.9%.
Hearing Disability Correlation Summary
| Measurement | Immigrants from Belgium | Icelander |
| Minimum | 0.12% | 1.3% |
| Maximum | 19.0% | 15.0% |
| Range | 18.9% | 13.7% |
| Mean | 4.8% | 5.4% |
| Median | 3.6% | 4.2% |
| Interquartile 25% (IQ1) | 2.9% | 3.3% |
| Interquartile 75% (IQ3) | 5.8% | 6.6% |
| Interquartile Range (IQR) | 2.9% | 3.4% |
| Standard Deviation (Sample) | 3.6% | 3.4% |
| Standard Deviation (Population) | 3.6% | 3.3% |
Similar Demographics by Hearing Disability
Demographics Similar to Immigrants from Belgium by Hearing Disability
In terms of hearing disability, the demographic groups most similar to Immigrants from Belgium are Immigrants from Italy (3.0%, a difference of 0.030%), Immigrants from Sweden (3.0%, a difference of 0.090%), Immigrants from Moldova (3.0%, a difference of 0.15%), Bulgarian (3.0%, a difference of 0.17%), and Immigrants from Ireland (3.0%, a difference of 0.40%).
| Demographics | Rating | Rank | Hearing Disability |
| Indonesians | 50.0 /100 | #174 | Average 3.0% |
| Immigrants | Romania | 48.4 /100 | #175 | Average 3.0% |
| Panamanians | 47.0 /100 | #176 | Average 3.0% |
| Immigrants | Philippines | 46.4 /100 | #177 | Average 3.0% |
| Japanese | 46.0 /100 | #178 | Average 3.0% |
| Immigrants | Moldova | 43.1 /100 | #179 | Average 3.0% |
| Immigrants | Sweden | 42.4 /100 | #180 | Average 3.0% |
| Immigrants | Belgium | 41.5 /100 | #181 | Average 3.0% |
| Immigrants | Italy | 41.1 /100 | #182 | Average 3.0% |
| Bulgarians | 39.7 /100 | #183 | Fair 3.0% |
| Immigrants | Ireland | 37.4 /100 | #184 | Fair 3.0% |
| Immigrants | Southern Europe | 35.3 /100 | #185 | Fair 3.0% |
| Immigrants | Mexico | 34.9 /100 | #186 | Fair 3.0% |
| Blacks/African Americans | 34.7 /100 | #187 | Fair 3.0% |
| Mexican American Indians | 34.7 /100 | #188 | Fair 3.0% |
Demographics Similar to Icelanders by Hearing Disability
In terms of hearing disability, the demographic groups most similar to Icelanders are Latvian (3.2%, a difference of 0.040%), Lebanese (3.2%, a difference of 0.090%), Mexican (3.2%, a difference of 0.17%), Bhutanese (3.2%, a difference of 0.27%), and Immigrants from Portugal (3.2%, a difference of 0.47%).
| Demographics | Rating | Rank | Hearing Disability |
| Russians | 7.1 /100 | #217 | Tragic 3.2% |
| Immigrants | Northern Europe | 7.0 /100 | #218 | Tragic 3.2% |
| New Zealanders | 6.8 /100 | #219 | Tragic 3.2% |
| Malaysians | 6.6 /100 | #220 | Tragic 3.2% |
| Immigrants | Laos | 6.6 /100 | #221 | Tragic 3.2% |
| Immigrants | Oceania | 6.5 /100 | #222 | Tragic 3.2% |
| Mexicans | 5.6 /100 | #223 | Tragic 3.2% |
| Icelanders | 5.2 /100 | #224 | Tragic 3.2% |
| Latvians | 5.1 /100 | #225 | Tragic 3.2% |
| Lebanese | 5.0 /100 | #226 | Tragic 3.2% |
| Bhutanese | 4.6 /100 | #227 | Tragic 3.2% |
| Immigrants | Portugal | 4.3 /100 | #228 | Tragic 3.2% |
| Maltese | 4.1 /100 | #229 | Tragic 3.2% |
| Greeks | 3.2 /100 | #230 | Tragic 3.2% |
| Luxembourgers | 2.9 /100 | #231 | Tragic 3.2% |