Immigrants from Bangladesh vs Bangladeshi Female Disability
COMPARE
Immigrants from Bangladesh
Bangladeshi
Female Disability
Female Disability Comparison
Immigrants from Bangladesh
Bangladeshis
11.8%
FEMALE DISABILITY
97.8/ 100
METRIC RATING
112th/ 347
METRIC RANK
13.1%
FEMALE DISABILITY
0.0/ 100
METRIC RATING
285th/ 347
METRIC RANK
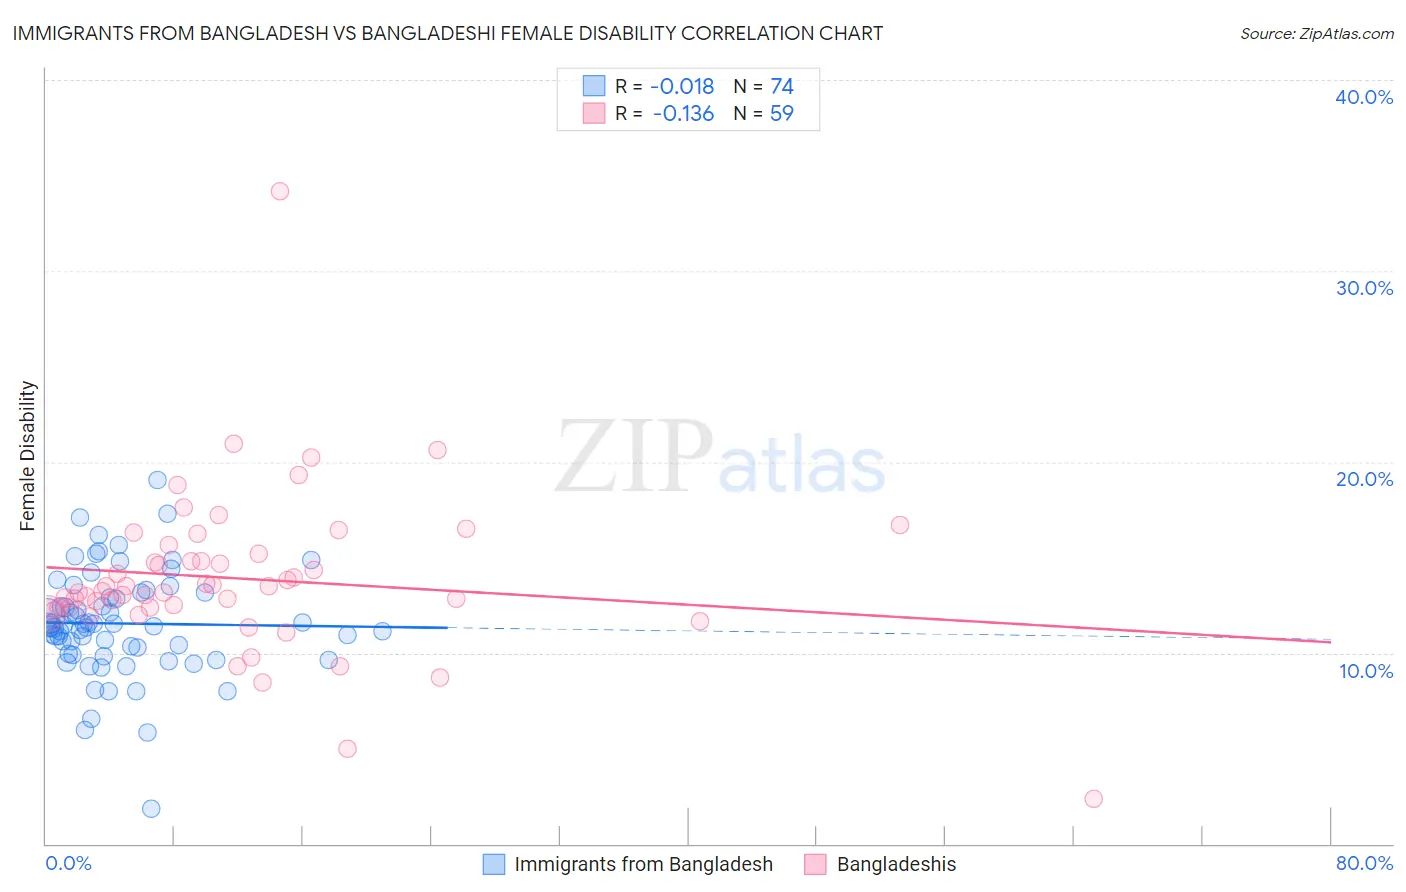
Immigrants from Bangladesh vs Bangladeshi Female Disability Correlation Chart
The statistical analysis conducted on geographies consisting of 203,667,560 people shows no correlation between the proportion of Immigrants from Bangladesh and percentage of females with a disability in the United States with a correlation coefficient (R) of -0.018 and weighted average of 11.8%. Similarly, the statistical analysis conducted on geographies consisting of 141,386,461 people shows a poor negative correlation between the proportion of Bangladeshis and percentage of females with a disability in the United States with a correlation coefficient (R) of -0.136 and weighted average of 13.1%, a difference of 11.4%.
Female Disability Correlation Summary
| Measurement | Immigrants from Bangladesh | Bangladeshi |
| Minimum | 1.8% | 2.3% |
| Maximum | 19.1% | 34.2% |
| Range | 17.3% | 31.9% |
| Mean | 11.5% | 13.9% |
| Median | 11.4% | 13.3% |
| Interquartile 25% (IQ1) | 10.0% | 12.4% |
| Interquartile 75% (IQ3) | 13.1% | 15.2% |
| Interquartile Range (IQR) | 3.2% | 2.8% |
| Standard Deviation (Sample) | 2.8% | 4.2% |
| Standard Deviation (Population) | 2.8% | 4.2% |
Similar Demographics by Female Disability
Demographics Similar to Immigrants from Bangladesh by Female Disability
In terms of female disability, the demographic groups most similar to Immigrants from Bangladesh are Immigrants from Belarus (11.8%, a difference of 0.010%), South African (11.8%, a difference of 0.040%), Brazilian (11.8%, a difference of 0.040%), Immigrants from Morocco (11.8%, a difference of 0.090%), and Costa Rican (11.7%, a difference of 0.12%).
| Demographics | Rating | Rank | Female Disability |
| Australians | 98.3 /100 | #105 | Exceptional 11.7% |
| Immigrants | Greece | 98.2 /100 | #106 | Exceptional 11.7% |
| Latvians | 98.2 /100 | #107 | Exceptional 11.7% |
| New Zealanders | 98.1 /100 | #108 | Exceptional 11.7% |
| Immigrants | Immigrants | 98.1 /100 | #109 | Exceptional 11.7% |
| Soviet Union | 98.1 /100 | #110 | Exceptional 11.7% |
| Costa Ricans | 98.1 /100 | #111 | Exceptional 11.7% |
| Immigrants | Bangladesh | 97.8 /100 | #112 | Exceptional 11.8% |
| Immigrants | Belarus | 97.8 /100 | #113 | Exceptional 11.8% |
| South Africans | 97.7 /100 | #114 | Exceptional 11.8% |
| Brazilians | 97.7 /100 | #115 | Exceptional 11.8% |
| Immigrants | Morocco | 97.6 /100 | #116 | Exceptional 11.8% |
| Immigrants | Eastern Europe | 97.2 /100 | #117 | Exceptional 11.8% |
| Immigrants | Nigeria | 97.2 /100 | #118 | Exceptional 11.8% |
| Immigrants | Uganda | 97.2 /100 | #119 | Exceptional 11.8% |
Demographics Similar to Bangladeshis by Female Disability
In terms of female disability, the demographic groups most similar to Bangladeshis are Hmong (13.1%, a difference of 0.050%), Fijian (13.1%, a difference of 0.050%), English (13.1%, a difference of 0.18%), Welsh (13.1%, a difference of 0.19%), and U.S. Virgin Islander (13.1%, a difference of 0.27%).
| Demographics | Rating | Rank | Female Disability |
| Scottish | 0.1 /100 | #278 | Tragic 13.0% |
| Arapaho | 0.1 /100 | #279 | Tragic 13.0% |
| Irish | 0.1 /100 | #280 | Tragic 13.1% |
| U.S. Virgin Islanders | 0.1 /100 | #281 | Tragic 13.1% |
| Welsh | 0.0 /100 | #282 | Tragic 13.1% |
| English | 0.0 /100 | #283 | Tragic 13.1% |
| Hmong | 0.0 /100 | #284 | Tragic 13.1% |
| Bangladeshis | 0.0 /100 | #285 | Tragic 13.1% |
| Fijians | 0.0 /100 | #286 | Tragic 13.1% |
| Yaqui | 0.0 /100 | #287 | Tragic 13.2% |
| Whites/Caucasians | 0.0 /100 | #288 | Tragic 13.2% |
| Tlingit-Haida | 0.0 /100 | #289 | Tragic 13.2% |
| Immigrants | Yemen | 0.0 /100 | #290 | Tragic 13.2% |
| Shoshone | 0.0 /100 | #291 | Tragic 13.2% |
| Yakama | 0.0 /100 | #292 | Tragic 13.2% |