Immigrants from Bahamas vs Iroquois Disability Age Over 75
COMPARE
Immigrants from Bahamas
Iroquois
Disability Age Over 75
Disability Age Over 75 Comparison
Immigrants from Bahamas
Iroquois
47.7%
DISABILITY AGE OVER 75
20.7/ 100
METRIC RATING
202nd/ 347
METRIC RANK
48.4%
DISABILITY AGE OVER 75
1.6/ 100
METRIC RATING
247th/ 347
METRIC RANK
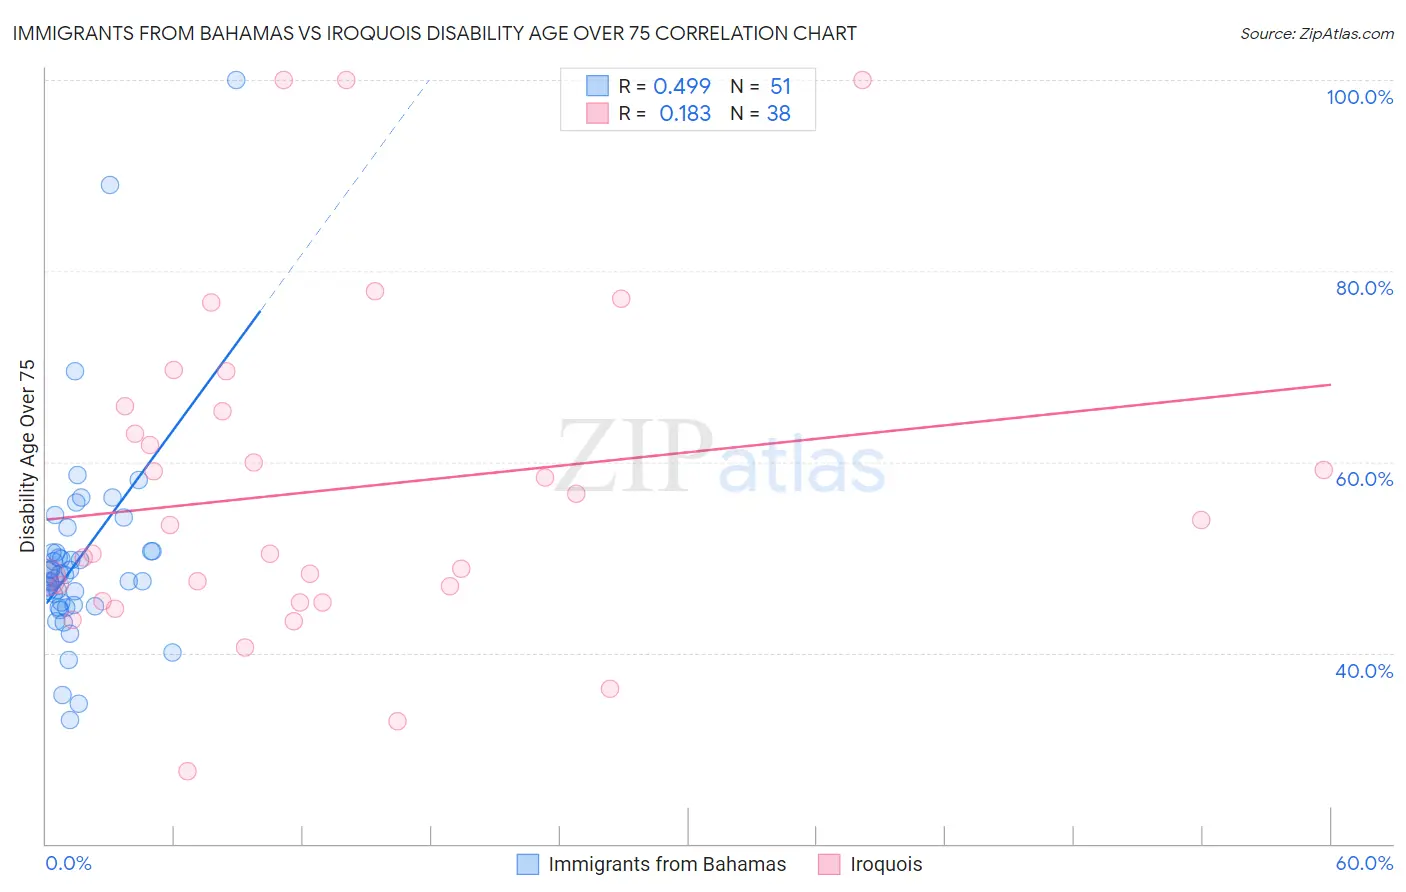
Immigrants from Bahamas vs Iroquois Disability Age Over 75 Correlation Chart
The statistical analysis conducted on geographies consisting of 104,589,625 people shows a moderate positive correlation between the proportion of Immigrants from Bahamas and percentage of population with a disability over the age of 75 in the United States with a correlation coefficient (R) of 0.499 and weighted average of 47.7%. Similarly, the statistical analysis conducted on geographies consisting of 207,037,823 people shows a poor positive correlation between the proportion of Iroquois and percentage of population with a disability over the age of 75 in the United States with a correlation coefficient (R) of 0.183 and weighted average of 48.4%, a difference of 1.6%.
Disability Age Over 75 Correlation Summary
| Measurement | Immigrants from Bahamas | Iroquois |
| Minimum | 33.0% | 27.6% |
| Maximum | 100.0% | 100.0% |
| Range | 67.0% | 72.4% |
| Mean | 49.9% | 57.1% |
| Median | 48.2% | 51.9% |
| Interquartile 25% (IQ1) | 45.0% | 45.4% |
| Interquartile 75% (IQ3) | 50.7% | 65.3% |
| Interquartile Range (IQR) | 5.6% | 19.9% |
| Standard Deviation (Sample) | 11.0% | 17.3% |
| Standard Deviation (Population) | 10.9% | 17.1% |
Similar Demographics by Disability Age Over 75
Demographics Similar to Immigrants from Bahamas by Disability Age Over 75
In terms of disability age over 75, the demographic groups most similar to Immigrants from Bahamas are Immigrants from Cuba (47.7%, a difference of 0.010%), Immigrants from Somalia (47.7%, a difference of 0.020%), Trinidadian and Tobagonian (47.7%, a difference of 0.020%), Nigerian (47.7%, a difference of 0.050%), and Immigrants from Eritrea (47.7%, a difference of 0.060%).
| Demographics | Rating | Rank | Disability Age Over 75 |
| Immigrants | Trinidad and Tobago | 25.3 /100 | #195 | Fair 47.6% |
| Immigrants | Portugal | 23.8 /100 | #196 | Fair 47.6% |
| Pakistanis | 23.4 /100 | #197 | Fair 47.7% |
| Immigrants | Ukraine | 23.2 /100 | #198 | Fair 47.7% |
| Immigrants | Eritrea | 22.4 /100 | #199 | Fair 47.7% |
| Immigrants | Somalia | 21.4 /100 | #200 | Fair 47.7% |
| Immigrants | Cuba | 20.9 /100 | #201 | Fair 47.7% |
| Immigrants | Bahamas | 20.7 /100 | #202 | Fair 47.7% |
| Trinidadians and Tobagonians | 20.0 /100 | #203 | Fair 47.7% |
| Nigerians | 19.2 /100 | #204 | Poor 47.7% |
| Immigrants | Ghana | 19.1 /100 | #205 | Poor 47.7% |
| Jamaicans | 19.0 /100 | #206 | Poor 47.7% |
| Immigrants | Syria | 17.4 /100 | #207 | Poor 47.8% |
| Immigrants | Senegal | 16.9 /100 | #208 | Poor 47.8% |
| Immigrants | Indonesia | 14.2 /100 | #209 | Poor 47.8% |
Demographics Similar to Iroquois by Disability Age Over 75
In terms of disability age over 75, the demographic groups most similar to Iroquois are Chippewa (48.4%, a difference of 0.020%), American (48.4%, a difference of 0.050%), Sri Lankan (48.5%, a difference of 0.060%), Afghan (48.4%, a difference of 0.070%), and Immigrants from Caribbean (48.4%, a difference of 0.16%).
| Demographics | Rating | Rank | Disability Age Over 75 |
| Tongans | 2.3 /100 | #240 | Tragic 48.3% |
| Native Hawaiians | 2.2 /100 | #241 | Tragic 48.3% |
| French American Indians | 2.2 /100 | #242 | Tragic 48.3% |
| Immigrants | Caribbean | 2.1 /100 | #243 | Tragic 48.4% |
| Afghans | 1.8 /100 | #244 | Tragic 48.4% |
| Americans | 1.7 /100 | #245 | Tragic 48.4% |
| Chippewa | 1.6 /100 | #246 | Tragic 48.4% |
| Iroquois | 1.6 /100 | #247 | Tragic 48.4% |
| Sri Lankans | 1.4 /100 | #248 | Tragic 48.5% |
| Iraqis | 1.0 /100 | #249 | Tragic 48.6% |
| West Indians | 0.8 /100 | #250 | Tragic 48.6% |
| Koreans | 0.8 /100 | #251 | Tragic 48.6% |
| Immigrants | South Eastern Asia | 0.7 /100 | #252 | Tragic 48.7% |
| British West Indians | 0.6 /100 | #253 | Tragic 48.7% |
| Immigrants | Vietnam | 0.6 /100 | #254 | Tragic 48.7% |