Immigrants from the Azores vs Navajo Disability Age 18 to 34
COMPARE
Immigrants from the Azores
Navajo
Disability Age 18 to 34
Disability Age 18 to 34 Comparison
Immigrants from the Azores
Navajo
8.5%
DISABILITY AGE 18 TO 34
0.0/ 100
METRIC RATING
336th/ 347
METRIC RANK
8.1%
DISABILITY AGE 18 TO 34
0.0/ 100
METRIC RATING
320th/ 347
METRIC RANK
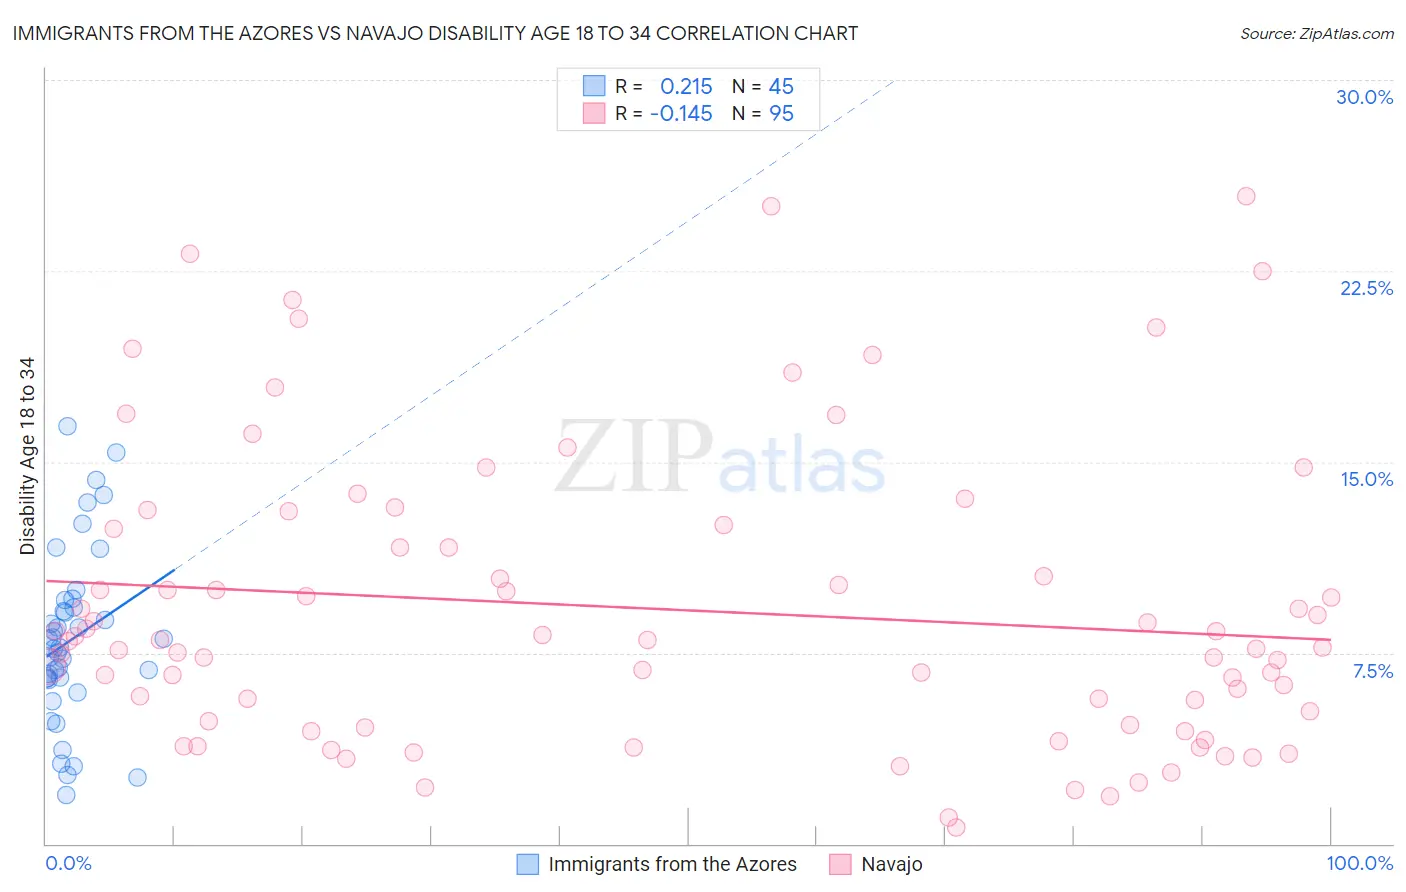
Immigrants from the Azores vs Navajo Disability Age 18 to 34 Correlation Chart
The statistical analysis conducted on geographies consisting of 46,222,932 people shows a weak positive correlation between the proportion of Immigrants from the Azores and percentage of population with a disability between the ages 18 and 35 in the United States with a correlation coefficient (R) of 0.215 and weighted average of 8.5%. Similarly, the statistical analysis conducted on geographies consisting of 224,432,910 people shows a poor negative correlation between the proportion of Navajo and percentage of population with a disability between the ages 18 and 35 in the United States with a correlation coefficient (R) of -0.145 and weighted average of 8.1%, a difference of 5.5%.
Disability Age 18 to 34 Correlation Summary
| Measurement | Immigrants from the Azores | Navajo |
| Minimum | 1.9% | 0.64% |
| Maximum | 16.4% | 25.5% |
| Range | 14.5% | 24.8% |
| Mean | 8.0% | 9.2% |
| Median | 7.7% | 7.9% |
| Interquartile 25% (IQ1) | 6.5% | 4.7% |
| Interquartile 75% (IQ3) | 9.4% | 12.3% |
| Interquartile Range (IQR) | 3.0% | 7.7% |
| Standard Deviation (Sample) | 3.4% | 5.7% |
| Standard Deviation (Population) | 3.3% | 5.7% |
Demographics Similar to Immigrants from the Azores and Navajo by Disability Age 18 to 34
In terms of disability age 18 to 34, the demographic groups most similar to Immigrants from the Azores are Ottawa (8.6%, a difference of 0.47%), Seminole (8.4%, a difference of 1.2%), Dutch West Indian (8.4%, a difference of 1.3%), Apache (8.4%, a difference of 1.5%), and Cherokee (8.7%, a difference of 1.9%). Similarly, the demographic groups most similar to Navajo are Aleut (8.1%, a difference of 0.050%), French Canadian (8.1%, a difference of 0.090%), Blackfeet (8.1%, a difference of 0.36%), Cree (8.1%, a difference of 0.42%), and French American Indian (8.2%, a difference of 0.93%).
| Demographics | Rating | Rank | Disability Age 18 to 34 |
| French Canadians | 0.0 /100 | #318 | Tragic 8.1% |
| Aleuts | 0.0 /100 | #319 | Tragic 8.1% |
| Navajo | 0.0 /100 | #320 | Tragic 8.1% |
| Blackfeet | 0.0 /100 | #321 | Tragic 8.1% |
| Cree | 0.0 /100 | #322 | Tragic 8.1% |
| French American Indians | 0.0 /100 | #323 | Tragic 8.2% |
| Cajuns | 0.0 /100 | #324 | Tragic 8.2% |
| Natives/Alaskans | 0.0 /100 | #325 | Tragic 8.2% |
| Potawatomi | 0.0 /100 | #326 | Tragic 8.2% |
| Sioux | 0.0 /100 | #327 | Tragic 8.2% |
| Delaware | 0.0 /100 | #328 | Tragic 8.2% |
| Crow | 0.0 /100 | #329 | Tragic 8.3% |
| Osage | 0.0 /100 | #330 | Tragic 8.3% |
| Comanche | 0.0 /100 | #331 | Tragic 8.3% |
| Puget Sound Salish | 0.0 /100 | #332 | Tragic 8.3% |
| Apache | 0.0 /100 | #333 | Tragic 8.4% |
| Dutch West Indians | 0.0 /100 | #334 | Tragic 8.4% |
| Seminole | 0.0 /100 | #335 | Tragic 8.4% |
| Immigrants | Azores | 0.0 /100 | #336 | Tragic 8.5% |
| Ottawa | 0.0 /100 | #337 | Tragic 8.6% |
| Cherokee | 0.0 /100 | #338 | Tragic 8.7% |