Samoan vs Navajo Disability Age 18 to 34
COMPARE
Samoan
Navajo
Disability Age 18 to 34
Disability Age 18 to 34 Comparison
Samoans
Navajo
7.0%
DISABILITY AGE 18 TO 34
3.2/ 100
METRIC RATING
232nd/ 347
METRIC RANK
8.1%
DISABILITY AGE 18 TO 34
0.0/ 100
METRIC RATING
320th/ 347
METRIC RANK
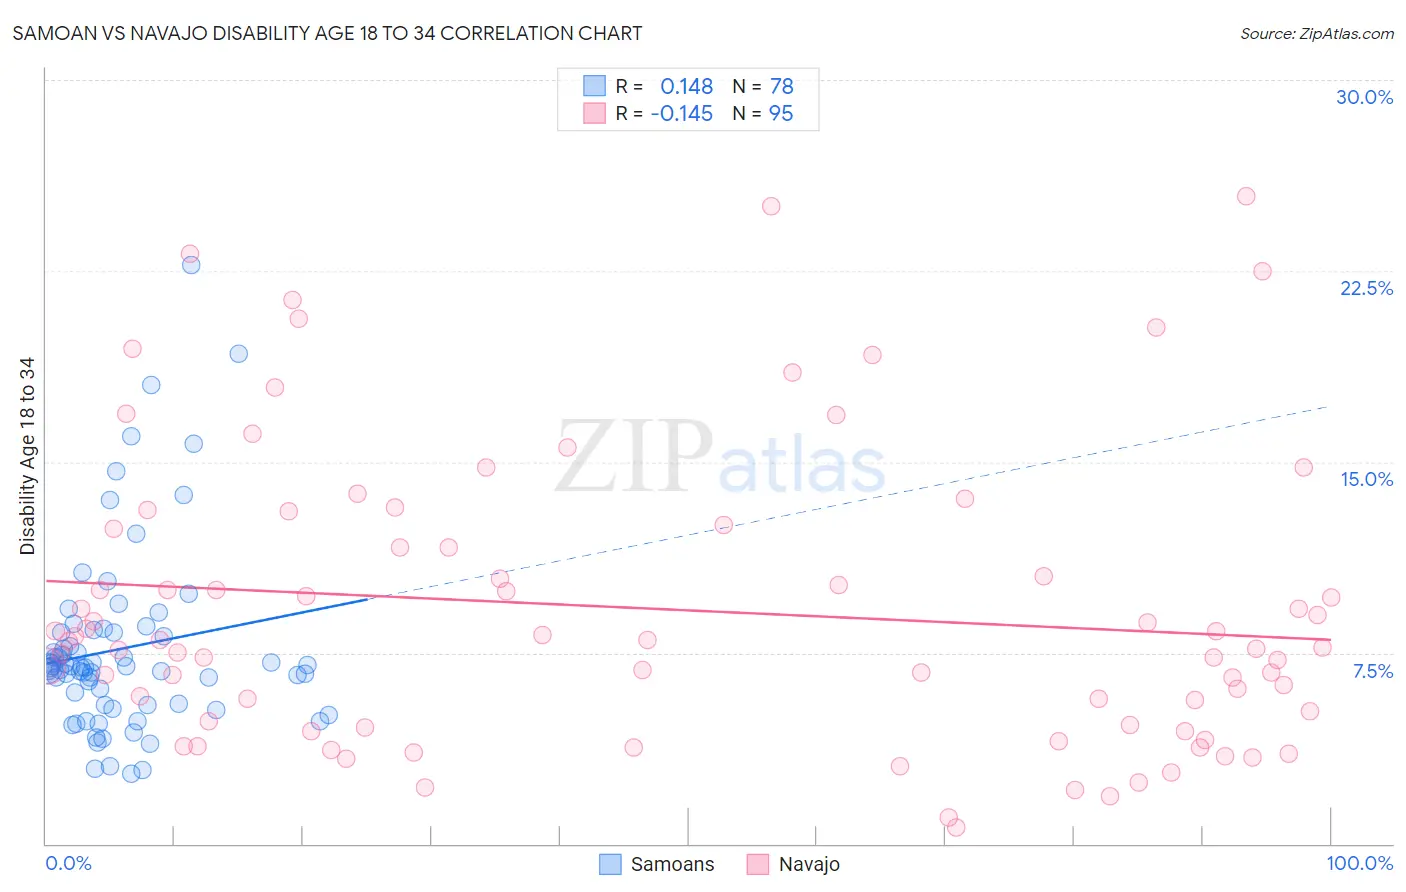
Samoan vs Navajo Disability Age 18 to 34 Correlation Chart
The statistical analysis conducted on geographies consisting of 224,878,190 people shows a poor positive correlation between the proportion of Samoans and percentage of population with a disability between the ages 18 and 35 in the United States with a correlation coefficient (R) of 0.148 and weighted average of 7.0%. Similarly, the statistical analysis conducted on geographies consisting of 224,432,910 people shows a poor negative correlation between the proportion of Navajo and percentage of population with a disability between the ages 18 and 35 in the United States with a correlation coefficient (R) of -0.145 and weighted average of 8.1%, a difference of 15.8%.
Disability Age 18 to 34 Correlation Summary
| Measurement | Samoan | Navajo |
| Minimum | 2.7% | 0.64% |
| Maximum | 22.7% | 25.5% |
| Range | 20.0% | 24.8% |
| Mean | 7.7% | 9.2% |
| Median | 6.9% | 7.9% |
| Interquartile 25% (IQ1) | 5.5% | 4.7% |
| Interquartile 75% (IQ3) | 8.3% | 12.3% |
| Interquartile Range (IQR) | 2.8% | 7.7% |
| Standard Deviation (Sample) | 3.7% | 5.7% |
| Standard Deviation (Population) | 3.6% | 5.7% |
Similar Demographics by Disability Age 18 to 34
Demographics Similar to Samoans by Disability Age 18 to 34
In terms of disability age 18 to 34, the demographic groups most similar to Samoans are New Zealander (7.0%, a difference of 0.26%), Ute (7.0%, a difference of 0.30%), Immigrants from North America (7.0%, a difference of 0.32%), Lithuanian (7.0%, a difference of 0.41%), and Immigrants from Yemen (7.0%, a difference of 0.44%).
| Demographics | Rating | Rank | Disability Age 18 to 34 |
| Central American Indians | 4.7 /100 | #225 | Tragic 6.9% |
| Ugandans | 4.4 /100 | #226 | Tragic 6.9% |
| Immigrants | Canada | 4.3 /100 | #227 | Tragic 7.0% |
| Immigrants | Yemen | 4.2 /100 | #228 | Tragic 7.0% |
| Lithuanians | 4.1 /100 | #229 | Tragic 7.0% |
| Immigrants | North America | 3.9 /100 | #230 | Tragic 7.0% |
| Ute | 3.8 /100 | #231 | Tragic 7.0% |
| Samoans | 3.2 /100 | #232 | Tragic 7.0% |
| New Zealanders | 2.7 /100 | #233 | Tragic 7.0% |
| Alsatians | 2.1 /100 | #234 | Tragic 7.0% |
| Sub-Saharan Africans | 1.7 /100 | #235 | Tragic 7.1% |
| Liberians | 1.5 /100 | #236 | Tragic 7.1% |
| Austrians | 1.3 /100 | #237 | Tragic 7.1% |
| Marshallese | 1.3 /100 | #238 | Tragic 7.1% |
| Italians | 1.2 /100 | #239 | Tragic 7.1% |
Demographics Similar to Navajo by Disability Age 18 to 34
In terms of disability age 18 to 34, the demographic groups most similar to Navajo are Aleut (8.1%, a difference of 0.050%), French Canadian (8.1%, a difference of 0.090%), Blackfeet (8.1%, a difference of 0.36%), Cree (8.1%, a difference of 0.42%), and Hmong (8.1%, a difference of 0.51%).
| Demographics | Rating | Rank | Disability Age 18 to 34 |
| Iroquois | 0.0 /100 | #313 | Tragic 7.9% |
| Colville | 0.0 /100 | #314 | Tragic 7.9% |
| Americans | 0.0 /100 | #315 | Tragic 8.0% |
| Puerto Ricans | 0.0 /100 | #316 | Tragic 8.0% |
| Hmong | 0.0 /100 | #317 | Tragic 8.1% |
| French Canadians | 0.0 /100 | #318 | Tragic 8.1% |
| Aleuts | 0.0 /100 | #319 | Tragic 8.1% |
| Navajo | 0.0 /100 | #320 | Tragic 8.1% |
| Blackfeet | 0.0 /100 | #321 | Tragic 8.1% |
| Cree | 0.0 /100 | #322 | Tragic 8.1% |
| French American Indians | 0.0 /100 | #323 | Tragic 8.2% |
| Cajuns | 0.0 /100 | #324 | Tragic 8.2% |
| Natives/Alaskans | 0.0 /100 | #325 | Tragic 8.2% |
| Potawatomi | 0.0 /100 | #326 | Tragic 8.2% |
| Sioux | 0.0 /100 | #327 | Tragic 8.2% |