Immigrants from the Azores vs Navajo Median Household Income
COMPARE
Immigrants from the Azores
Navajo
Median Household Income
Median Household Income Comparison
Immigrants from the Azores
Navajo
$80,357
MEDIAN HOUSEHOLD INCOME
4.5/ 100
METRIC RATING
233rd/ 347
METRIC RANK
$59,159
MEDIAN HOUSEHOLD INCOME
0.0/ 100
METRIC RATING
346th/ 347
METRIC RANK
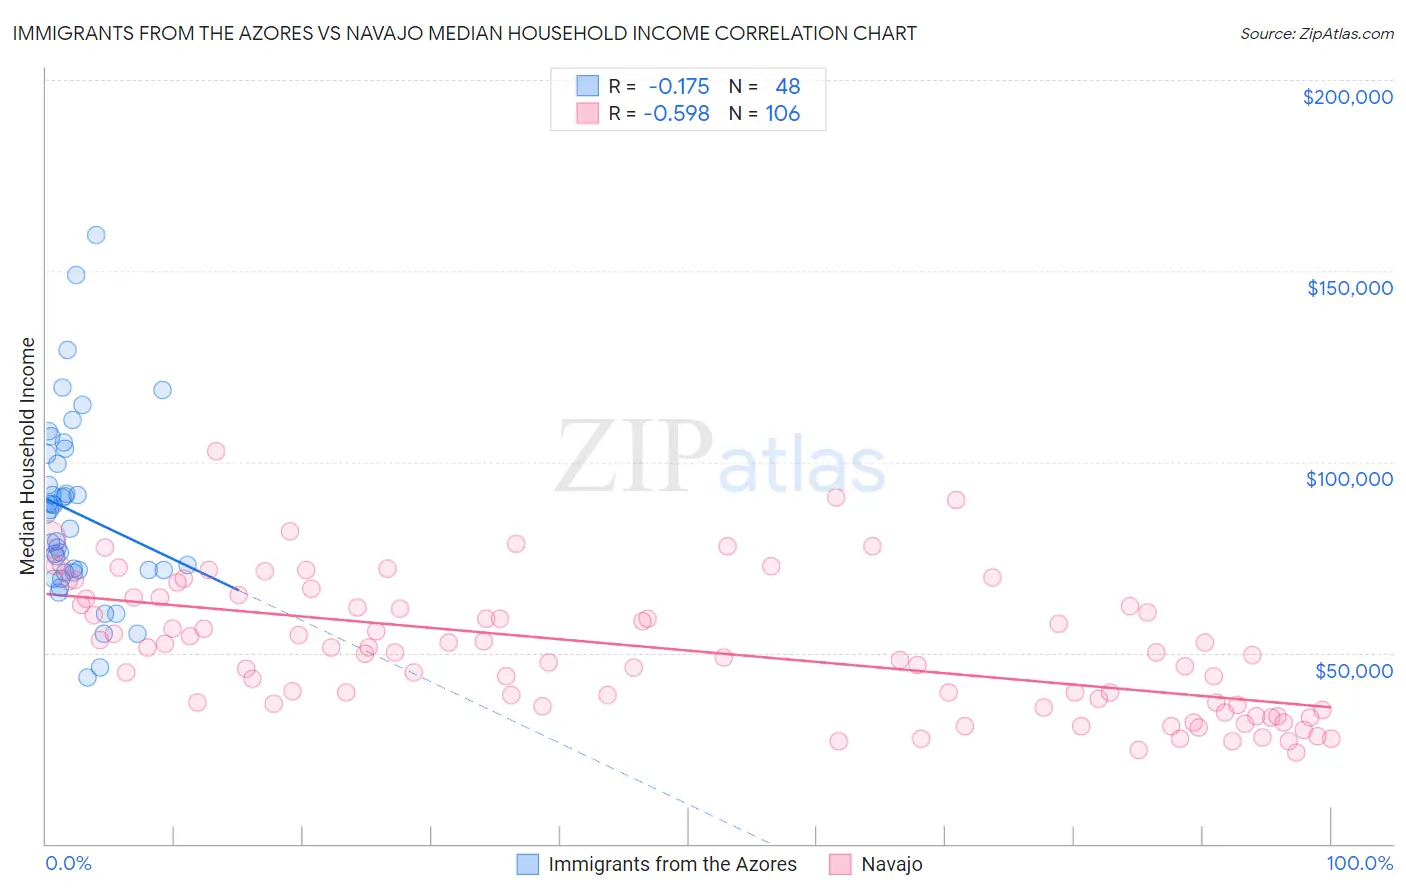
Immigrants from the Azores vs Navajo Median Household Income Correlation Chart
The statistical analysis conducted on geographies consisting of 46,252,874 people shows a poor negative correlation between the proportion of Immigrants from the Azores and median household income in the United States with a correlation coefficient (R) of -0.175 and weighted average of $80,357. Similarly, the statistical analysis conducted on geographies consisting of 224,715,573 people shows a substantial negative correlation between the proportion of Navajo and median household income in the United States with a correlation coefficient (R) of -0.598 and weighted average of $59,159, a difference of 35.8%.
Median Household Income Correlation Summary
| Measurement | Immigrants from the Azores | Navajo |
| Minimum | $43,579 | $24,004 |
| Maximum | $159,500 | $102,885 |
| Range | $115,921 | $78,881 |
| Mean | $86,608 | $51,106 |
| Median | $84,537 | $50,167 |
| Interquartile 25% (IQ1) | $71,270 | $36,185 |
| Interquartile 75% (IQ3) | $100,707 | $64,286 |
| Interquartile Range (IQR) | $29,437 | $28,101 |
| Standard Deviation (Sample) | $23,960 | $17,310 |
| Standard Deviation (Population) | $23,710 | $17,228 |
Similar Demographics by Median Household Income
Demographics Similar to Immigrants from the Azores by Median Household Income
In terms of median household income, the demographic groups most similar to Immigrants from the Azores are Immigrants from Trinidad and Tobago ($80,373, a difference of 0.020%), Immigrants from Ecuador ($80,341, a difference of 0.020%), Immigrants from Guyana ($80,324, a difference of 0.040%), Bermudan ($80,406, a difference of 0.060%), and Trinidadian and Tobagonian ($80,402, a difference of 0.060%).
| Demographics | Rating | Rank | Median Household Income |
| Immigrants | Panama | 6.2 /100 | #226 | Tragic $80,873 |
| Guyanese | 5.7 /100 | #227 | Tragic $80,734 |
| Immigrants | Bangladesh | 5.7 /100 | #228 | Tragic $80,722 |
| Delaware | 5.0 /100 | #229 | Tragic $80,527 |
| Bermudans | 4.7 /100 | #230 | Tragic $80,406 |
| Trinidadians and Tobagonians | 4.7 /100 | #231 | Tragic $80,402 |
| Immigrants | Trinidad and Tobago | 4.6 /100 | #232 | Tragic $80,373 |
| Immigrants | Azores | 4.5 /100 | #233 | Tragic $80,357 |
| Immigrants | Ecuador | 4.5 /100 | #234 | Tragic $80,341 |
| Immigrants | Guyana | 4.5 /100 | #235 | Tragic $80,324 |
| Immigrants | Bosnia and Herzegovina | 3.4 /100 | #236 | Tragic $79,888 |
| Nicaraguans | 3.1 /100 | #237 | Tragic $79,737 |
| Barbadians | 3.0 /100 | #238 | Tragic $79,664 |
| Alaska Natives | 2.7 /100 | #239 | Tragic $79,509 |
| Immigrants | Western Africa | 2.7 /100 | #240 | Tragic $79,490 |
Demographics Similar to Navajo by Median Household Income
In terms of median household income, the demographic groups most similar to Navajo are Puerto Rican ($59,197, a difference of 0.060%), Tohono O'odham ($61,663, a difference of 4.2%), Houma ($62,575, a difference of 5.8%), Pima ($63,262, a difference of 6.9%), and Crow ($63,681, a difference of 7.6%).
| Demographics | Rating | Rank | Median Household Income |
| Creek | 0.0 /100 | #333 | Tragic $67,715 |
| Blacks/African Americans | 0.0 /100 | #334 | Tragic $67,573 |
| Cheyenne | 0.0 /100 | #335 | Tragic $66,974 |
| Immigrants | Congo | 0.0 /100 | #336 | Tragic $66,768 |
| Kiowa | 0.0 /100 | #337 | Tragic $65,914 |
| Immigrants | Yemen | 0.0 /100 | #338 | Tragic $65,194 |
| Hopi | 0.0 /100 | #339 | Tragic $65,043 |
| Pueblo | 0.0 /100 | #340 | Tragic $64,692 |
| Crow | 0.0 /100 | #341 | Tragic $63,681 |
| Pima | 0.0 /100 | #342 | Tragic $63,262 |
| Houma | 0.0 /100 | #343 | Tragic $62,575 |
| Tohono O'odham | 0.0 /100 | #344 | Tragic $61,663 |
| Puerto Ricans | 0.0 /100 | #345 | Tragic $59,197 |
| Navajo | 0.0 /100 | #346 | Tragic $59,159 |
| Lumbee | 0.0 /100 | #347 | Tragic $54,644 |