Immigrants from the Azores vs Moroccan Disability Age 18 to 34
COMPARE
Immigrants from the Azores
Moroccan
Disability Age 18 to 34
Disability Age 18 to 34 Comparison
Immigrants from the Azores
Moroccans
8.5%
DISABILITY AGE 18 TO 34
0.0/ 100
METRIC RATING
336th/ 347
METRIC RANK
6.4%
DISABILITY AGE 18 TO 34
85.2/ 100
METRIC RATING
145th/ 347
METRIC RANK
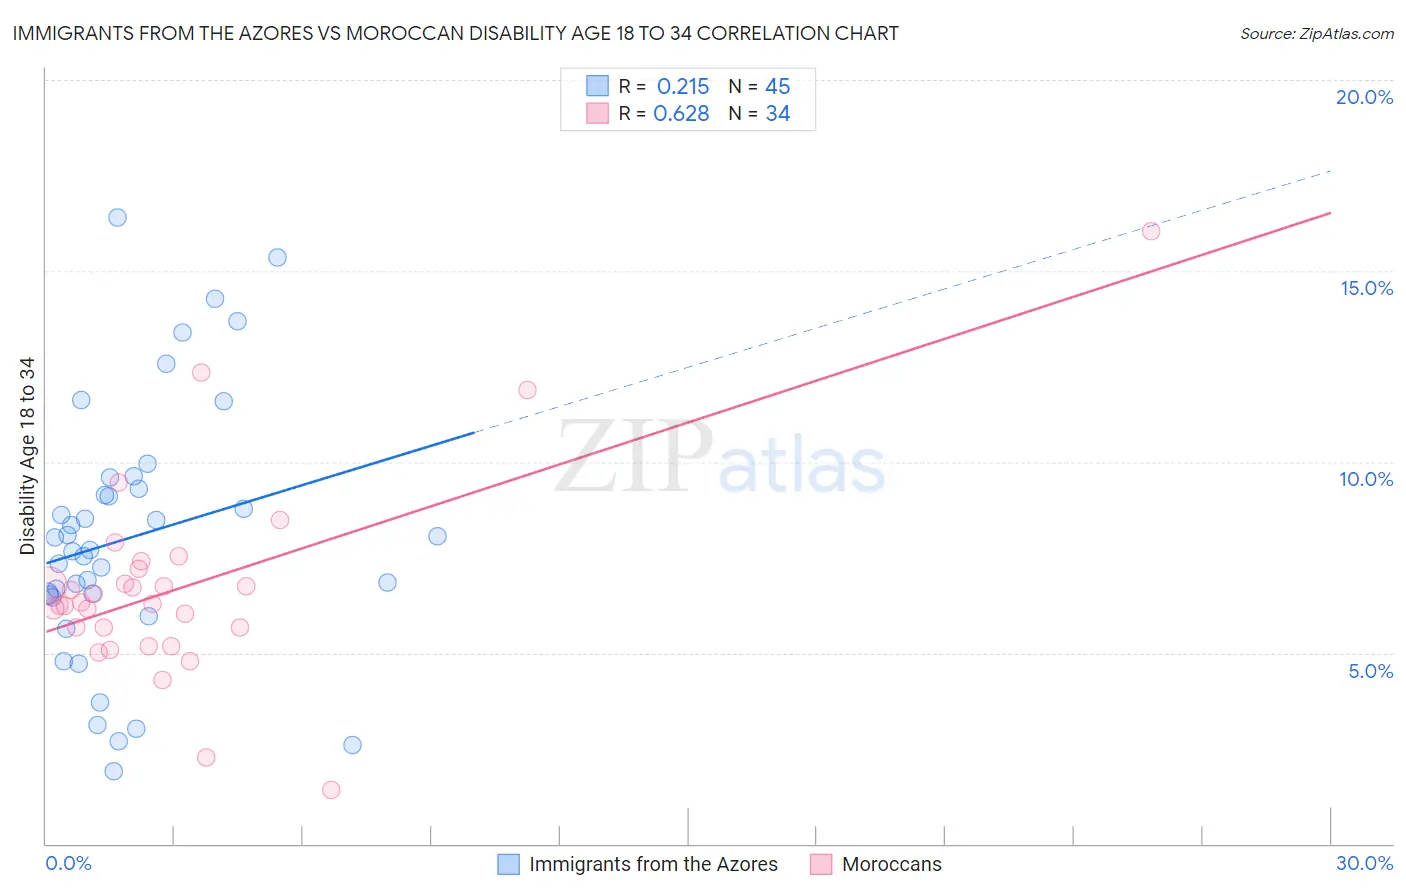
Immigrants from the Azores vs Moroccan Disability Age 18 to 34 Correlation Chart
The statistical analysis conducted on geographies consisting of 46,222,932 people shows a weak positive correlation between the proportion of Immigrants from the Azores and percentage of population with a disability between the ages 18 and 35 in the United States with a correlation coefficient (R) of 0.215 and weighted average of 8.5%. Similarly, the statistical analysis conducted on geographies consisting of 201,641,567 people shows a significant positive correlation between the proportion of Moroccans and percentage of population with a disability between the ages 18 and 35 in the United States with a correlation coefficient (R) of 0.628 and weighted average of 6.4%, a difference of 33.5%.
Disability Age 18 to 34 Correlation Summary
| Measurement | Immigrants from the Azores | Moroccan |
| Minimum | 1.9% | 1.4% |
| Maximum | 16.4% | 16.0% |
| Range | 14.5% | 14.6% |
| Mean | 8.0% | 6.7% |
| Median | 7.7% | 6.3% |
| Interquartile 25% (IQ1) | 6.5% | 5.7% |
| Interquartile 75% (IQ3) | 9.4% | 7.2% |
| Interquartile Range (IQR) | 3.0% | 1.5% |
| Standard Deviation (Sample) | 3.4% | 2.6% |
| Standard Deviation (Population) | 3.3% | 2.6% |
Similar Demographics by Disability Age 18 to 34
Demographics Similar to Immigrants from the Azores by Disability Age 18 to 34
In terms of disability age 18 to 34, the demographic groups most similar to Immigrants from the Azores are Ottawa (8.6%, a difference of 0.47%), Seminole (8.4%, a difference of 1.2%), Dutch West Indian (8.4%, a difference of 1.3%), Apache (8.4%, a difference of 1.5%), and Cherokee (8.7%, a difference of 1.9%).
| Demographics | Rating | Rank | Disability Age 18 to 34 |
| Crow | 0.0 /100 | #329 | Tragic 8.3% |
| Osage | 0.0 /100 | #330 | Tragic 8.3% |
| Comanche | 0.0 /100 | #331 | Tragic 8.3% |
| Puget Sound Salish | 0.0 /100 | #332 | Tragic 8.3% |
| Apache | 0.0 /100 | #333 | Tragic 8.4% |
| Dutch West Indians | 0.0 /100 | #334 | Tragic 8.4% |
| Seminole | 0.0 /100 | #335 | Tragic 8.4% |
| Immigrants | Azores | 0.0 /100 | #336 | Tragic 8.5% |
| Ottawa | 0.0 /100 | #337 | Tragic 8.6% |
| Cherokee | 0.0 /100 | #338 | Tragic 8.7% |
| Kiowa | 0.0 /100 | #339 | Tragic 8.8% |
| Choctaw | 0.0 /100 | #340 | Tragic 9.0% |
| Chickasaw | 0.0 /100 | #341 | Tragic 9.0% |
| Yakama | 0.0 /100 | #342 | Tragic 9.0% |
| Chippewa | 0.0 /100 | #343 | Tragic 9.0% |
Demographics Similar to Moroccans by Disability Age 18 to 34
In terms of disability age 18 to 34, the demographic groups most similar to Moroccans are Albanian (6.4%, a difference of 0.0%), Belizean (6.4%, a difference of 0.050%), Immigrants from Latvia (6.4%, a difference of 0.17%), South American Indian (6.4%, a difference of 0.19%), and Immigrants from South Africa (6.4%, a difference of 0.21%).
| Demographics | Rating | Rank | Disability Age 18 to 34 |
| Spanish American Indians | 87.7 /100 | #138 | Excellent 6.4% |
| Immigrants | Belize | 87.4 /100 | #139 | Excellent 6.4% |
| Immigrants | Fiji | 87.3 /100 | #140 | Excellent 6.4% |
| Jamaicans | 86.8 /100 | #141 | Excellent 6.4% |
| South American Indians | 86.5 /100 | #142 | Excellent 6.4% |
| Immigrants | Latvia | 86.4 /100 | #143 | Excellent 6.4% |
| Albanians | 85.3 /100 | #144 | Excellent 6.4% |
| Moroccans | 85.2 /100 | #145 | Excellent 6.4% |
| Belizeans | 84.9 /100 | #146 | Excellent 6.4% |
| Immigrants | South Africa | 83.7 /100 | #147 | Excellent 6.4% |
| Immigrants | Belgium | 83.5 /100 | #148 | Excellent 6.4% |
| Hondurans | 83.1 /100 | #149 | Excellent 6.4% |
| Immigrants | Dominican Republic | 82.7 /100 | #150 | Excellent 6.4% |
| Tongans | 81.9 /100 | #151 | Excellent 6.4% |
| Bulgarians | 78.3 /100 | #152 | Good 6.5% |