Cuban vs Navajo Disability Age 18 to 34
COMPARE
Cuban
Navajo
Disability Age 18 to 34
Disability Age 18 to 34 Comparison
Cubans
Navajo
5.7%
DISABILITY AGE 18 TO 34
100.0/ 100
METRIC RATING
23rd/ 347
METRIC RANK
8.1%
DISABILITY AGE 18 TO 34
0.0/ 100
METRIC RATING
320th/ 347
METRIC RANK
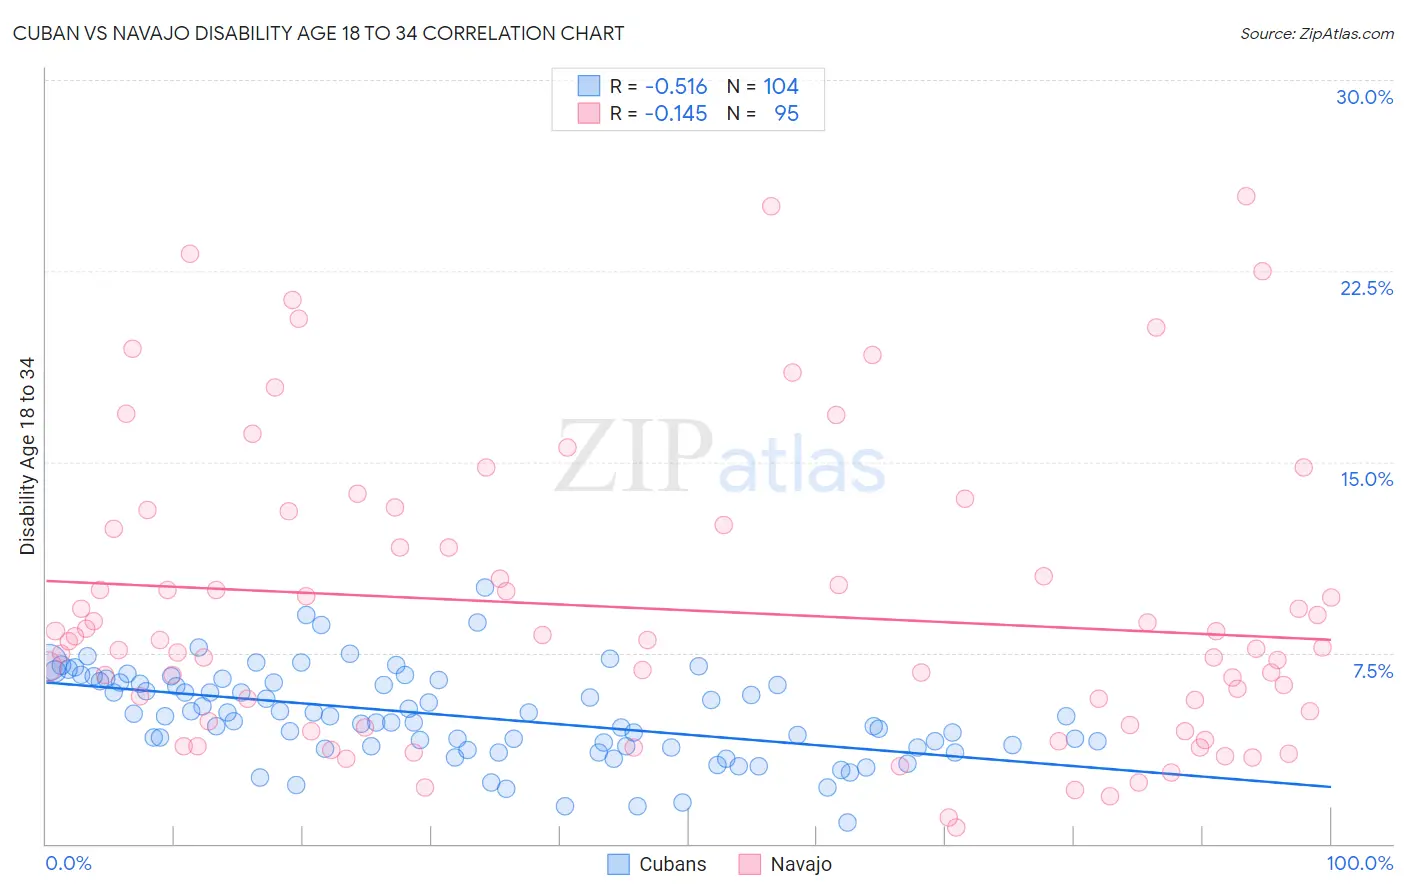
Cuban vs Navajo Disability Age 18 to 34 Correlation Chart
The statistical analysis conducted on geographies consisting of 448,003,598 people shows a substantial negative correlation between the proportion of Cubans and percentage of population with a disability between the ages 18 and 35 in the United States with a correlation coefficient (R) of -0.516 and weighted average of 5.7%. Similarly, the statistical analysis conducted on geographies consisting of 224,432,910 people shows a poor negative correlation between the proportion of Navajo and percentage of population with a disability between the ages 18 and 35 in the United States with a correlation coefficient (R) of -0.145 and weighted average of 8.1%, a difference of 41.8%.
Disability Age 18 to 34 Correlation Summary
| Measurement | Cuban | Navajo |
| Minimum | 0.83% | 0.64% |
| Maximum | 10.1% | 25.5% |
| Range | 9.2% | 24.8% |
| Mean | 5.0% | 9.2% |
| Median | 5.0% | 7.9% |
| Interquartile 25% (IQ1) | 3.8% | 4.7% |
| Interquartile 75% (IQ3) | 6.4% | 12.3% |
| Interquartile Range (IQR) | 2.6% | 7.7% |
| Standard Deviation (Sample) | 1.8% | 5.7% |
| Standard Deviation (Population) | 1.8% | 5.7% |
Similar Demographics by Disability Age 18 to 34
Demographics Similar to Cubans by Disability Age 18 to 34
In terms of disability age 18 to 34, the demographic groups most similar to Cubans are Immigrants from Argentina (5.7%, a difference of 0.10%), Immigrants from Singapore (5.7%, a difference of 0.14%), Immigrants from Colombia (5.7%, a difference of 0.29%), Immigrants from Venezuela (5.7%, a difference of 0.40%), and Soviet Union (5.7%, a difference of 0.49%).
| Demographics | Rating | Rank | Disability Age 18 to 34 |
| Immigrants | Israel | 100.0 /100 | #16 | Exceptional 5.6% |
| Immigrants | Eastern Asia | 100.0 /100 | #17 | Exceptional 5.6% |
| Immigrants | Bolivia | 100.0 /100 | #18 | Exceptional 5.6% |
| Thais | 100.0 /100 | #19 | Exceptional 5.6% |
| Immigrants | Bangladesh | 100.0 /100 | #20 | Exceptional 5.6% |
| Immigrants | South Central Asia | 100.0 /100 | #21 | Exceptional 5.7% |
| Immigrants | Nicaragua | 100.0 /100 | #22 | Exceptional 5.7% |
| Cubans | 100.0 /100 | #23 | Exceptional 5.7% |
| Immigrants | Argentina | 100.0 /100 | #24 | Exceptional 5.7% |
| Immigrants | Singapore | 100.0 /100 | #25 | Exceptional 5.7% |
| Immigrants | Colombia | 100.0 /100 | #26 | Exceptional 5.7% |
| Immigrants | Venezuela | 99.9 /100 | #27 | Exceptional 5.7% |
| Soviet Union | 99.9 /100 | #28 | Exceptional 5.7% |
| Immigrants | Ecuador | 99.9 /100 | #29 | Exceptional 5.7% |
| Immigrants | Pakistan | 99.9 /100 | #30 | Exceptional 5.8% |
Demographics Similar to Navajo by Disability Age 18 to 34
In terms of disability age 18 to 34, the demographic groups most similar to Navajo are Aleut (8.1%, a difference of 0.050%), French Canadian (8.1%, a difference of 0.090%), Blackfeet (8.1%, a difference of 0.36%), Cree (8.1%, a difference of 0.42%), and Hmong (8.1%, a difference of 0.51%).
| Demographics | Rating | Rank | Disability Age 18 to 34 |
| Iroquois | 0.0 /100 | #313 | Tragic 7.9% |
| Colville | 0.0 /100 | #314 | Tragic 7.9% |
| Americans | 0.0 /100 | #315 | Tragic 8.0% |
| Puerto Ricans | 0.0 /100 | #316 | Tragic 8.0% |
| Hmong | 0.0 /100 | #317 | Tragic 8.1% |
| French Canadians | 0.0 /100 | #318 | Tragic 8.1% |
| Aleuts | 0.0 /100 | #319 | Tragic 8.1% |
| Navajo | 0.0 /100 | #320 | Tragic 8.1% |
| Blackfeet | 0.0 /100 | #321 | Tragic 8.1% |
| Cree | 0.0 /100 | #322 | Tragic 8.1% |
| French American Indians | 0.0 /100 | #323 | Tragic 8.2% |
| Cajuns | 0.0 /100 | #324 | Tragic 8.2% |
| Natives/Alaskans | 0.0 /100 | #325 | Tragic 8.2% |
| Potawatomi | 0.0 /100 | #326 | Tragic 8.2% |
| Sioux | 0.0 /100 | #327 | Tragic 8.2% |