Immigrants from the Azores vs Immigrants from Peru Vision Disability

COMPARE

Immigrants from the Azores
Race
Ancestry
AfghanAfricanAlaska NativeAlaskan AthabascanAlbanianAleutAlsatianAmericanApacheArabArapahoArgentineanArmenianAssyrian/Chaldean/SyriacAustralianAustrianBahamianBangladeshiBarbadianBasqueBelgianBelizeanBermudanBhutaneseBlackfeetBolivianBrazilianBritishBritish West IndianBulgarianBurmeseCajunCambodianCanadianCape VerdeanCarpatho RusynCelticCentral AmericanCentral American IndianCherokeeCheyenneChickasawChileanChineseChippewaChoctawColombianColvilleComancheCosta RicanCreeCreekCroatianCrowCubanCypriotCzechCzechoslovakianDanishDelawareDominicanDutchDutch West IndianEastern EuropeanEcuadorianEgyptianEnglishEstonianEthiopianEuropeanFijianFilipinoFinnishFrenchFrench American IndianFrench CanadianGermanGerman RussianGhanaianGreekGuamanian/ChamorroGuatemalanGuyaneseHaitianHmongHonduranHopiHoumaHungarianIcelanderIndian (Asian)IndonesianInupiatIranianIraqiIrishIroquoisIsraeliItalianJamaicanJapaneseJordanianKenyanKiowaKoreanLaotianLatvianLebaneseLiberianLithuanianLumbeeLuxembourgerMacedonianMalaysianMalteseMarshalleseMenomineeMexicanMexican American IndianMongolianMoroccanNative HawaiianNavajoNepaleseNew ZealanderNicaraguanNigerianNorthern EuropeanNorwegianOkinawanOsageOttawaPaiutePakistaniPalestinianPanamanianParaguayanPennsylvania GermanPeruvianPimaPolishPortuguesePotawatomiPuebloPuerto RicanPuget Sound SalishRomanianRussianSalvadoranSamoanScandinavianScotch-IrishScottishSeminoleSenegaleseSerbianShoshoneSierra LeoneanSiouxSlavicSlovakSloveneSomaliSouth AfricanSouth AmericanSouth American IndianSoviet UnionSpaniardSpanishSpanish AmericanSpanish American IndianSri LankanSubsaharan AfricanSudaneseSwedishSwissSyrianTaiwaneseThaiTlingit-HaidaTohono O'OdhamTonganTrinidadian and TobagonianTsimshianTurkishU.S. Virgin IslanderUgandanUkrainianUruguayanUteVenezuelanVietnameseWelshWest IndianYakamaYaquiYugoslavianYumanYup'ikZimbabwean
Immigration
NonimmigrantsImmigrantsAfghanistanAfricaAlbaniaArgentinaArmeniaAsiaAustraliaAustriaBahamasBangladeshBarbadosBelarusBelgiumBelizeBoliviaBosnia and HerzegovinaBrazilBulgariaBurma/MyanmarCabo VerdeCambodiaCameroonCanadaCaribbeanCentral AmericaChileChinaColombiaCongoCosta RicaCroatiaCubaCzechoslovakiaDenmarkDominicaDominican RepublicEastern AfricaEastern AsiaEastern EuropeEcuadorEgyptEl SalvadorEnglandEritreaEthiopiaEuropeFijiFranceGermanyGhanaGreeceGrenadaGuatemalaGuyanaHaitiHondurasHong KongHungaryIndiaIndonesiaIranIraqIrelandIsraelItalyJamaicaJapanJordanKazakhstanKenyaKoreaKuwaitLaosLatin AmericaLatviaLebanonLiberiaLithuaniaMalaysiaMexicoMicronesiaMiddle AfricaMoldovaMoroccoNepalNetherlandsNicaraguaNigeriaNorth AmericaNorth MacedoniaNorthern AfricaNorthern EuropeNorwayOceaniaPakistanPanamaPhilippinesPolandPortugalRomaniaRussiaSaudi ArabiaScotlandSenegalSerbiaSierra LeoneSingaporeSomaliaSouth AfricaSouth AmericaSouth Central AsiaSouth Eastern AsiaSouthern EuropeSpainSri LankaSt. Vincent and the GrenadinesSudanSwedenSwitzerlandSyriaTaiwanThailandTrinidad and TobagoTurkeyUgandaUkraineUruguayUzbekistanVenezuelaVietnamWest IndiesWestern AfricaWestern AsiaWestern EuropeYemenZaireZimbabweAzores
Immigrants from Peru
Race
Ancestry
AfghanAfricanAlaska NativeAlaskan AthabascanAlbanianAleutAlsatianAmericanApacheArabArapahoArgentineanArmenianAssyrian/Chaldean/SyriacAustralianAustrianBahamianBangladeshiBarbadianBasqueBelgianBelizeanBermudanBhutaneseBlackfeetBolivianBrazilianBritishBritish West IndianBulgarianBurmeseCajunCambodianCanadianCape VerdeanCarpatho RusynCelticCentral AmericanCentral American IndianCherokeeCheyenneChickasawChileanChineseChippewaChoctawColombianColvilleComancheCosta RicanCreeCreekCroatianCrowCubanCypriotCzechCzechoslovakianDanishDelawareDominicanDutchDutch West IndianEastern EuropeanEcuadorianEgyptianEnglishEstonianEthiopianEuropeanFijianFilipinoFinnishFrenchFrench American IndianFrench CanadianGermanGerman RussianGhanaianGreekGuamanian/ChamorroGuatemalanGuyaneseHaitianHmongHonduranHopiHoumaHungarianIcelanderIndian (Asian)IndonesianInupiatIranianIraqiIrishIroquoisIsraeliItalianJamaicanJapaneseJordanianKenyanKiowaKoreanLaotianLatvianLebaneseLiberianLithuanianLumbeeLuxembourgerMacedonianMalaysianMalteseMarshalleseMenomineeMexicanMexican American IndianMongolianMoroccanNative HawaiianNavajoNepaleseNew ZealanderNicaraguanNigerianNorthern EuropeanNorwegianOkinawanOsageOttawaPaiutePakistaniPalestinianPanamanianParaguayanPennsylvania GermanPeruvianPimaPolishPortuguesePotawatomiPuebloPuerto RicanPuget Sound SalishRomanianRussianSalvadoranSamoanScandinavianScotch-IrishScottishSeminoleSenegaleseSerbianShoshoneSierra LeoneanSiouxSlavicSlovakSloveneSomaliSouth AfricanSouth AmericanSouth American IndianSoviet UnionSpaniardSpanishSpanish AmericanSpanish American IndianSri LankanSubsaharan AfricanSudaneseSwedishSwissSyrianTaiwaneseThaiTlingit-HaidaTohono O'OdhamTonganTrinidadian and TobagonianTsimshianTurkishU.S. Virgin IslanderUgandanUkrainianUruguayanUteVenezuelanVietnameseWelshWest IndianYakamaYaquiYugoslavianYumanYup'ikZimbabwean
Immigration
NonimmigrantsImmigrantsAfghanistanAfricaAlbaniaArgentinaArmeniaAsiaAustraliaAustriaBahamasBangladeshBarbadosBelarusBelgiumBelizeBoliviaBosnia and HerzegovinaBrazilBulgariaBurma/MyanmarCabo VerdeCambodiaCameroonCanadaCaribbeanCentral AmericaChileChinaColombiaCongoCosta RicaCroatiaCubaCzechoslovakiaDenmarkDominicaDominican RepublicEastern AfricaEastern AsiaEastern EuropeEcuadorEgyptEl SalvadorEnglandEritreaEthiopiaEuropeFijiFranceGermanyGhanaGreeceGrenadaGuatemalaGuyanaHaitiHondurasHong KongHungaryIndiaIndonesiaIranIraqIrelandIsraelItalyJamaicaJapanJordanKazakhstanKenyaKoreaKuwaitLaosLatin AmericaLatviaLebanonLiberiaLithuaniaMalaysiaMexicoMicronesiaMiddle AfricaMoldovaMoroccoNepalNetherlandsNicaraguaNigeriaNorth AmericaNorth MacedoniaNorthern AfricaNorthern EuropeNorwayOceaniaPakistanPanamaPeruPhilippinesPolandPortugalRomaniaRussiaSaudi ArabiaScotlandSenegalSerbiaSierra LeoneSingaporeSomaliaSouth AfricaSouth AmericaSouth Central AsiaSouth Eastern AsiaSouthern EuropeSpainSri LankaSt. Vincent and the GrenadinesSudanSwedenSwitzerlandSyriaTaiwanThailandTrinidad and TobagoTurkeyUgandaUkraineUruguayUzbekistanVenezuelaVietnamWest IndiesWestern AfricaWestern AsiaWestern EuropeYemenZaireZimbabwe
Vision Disability
Income
Poverty
Unemployment
Labor Participation
Family Structure
Vehicle Availability
Education Level
Disability

Vision Disability Comparison

Immigrants from the Azores

Immigrants from Peru

Tragic
Excellent
2.4%
VISION DISABILITY
0.1/ 100
METRIC RATING
271st/ 347
METRIC RANK
2.1%
VISION DISABILITY
89.5/ 100
METRIC RATING
126th/ 347
METRIC RANK

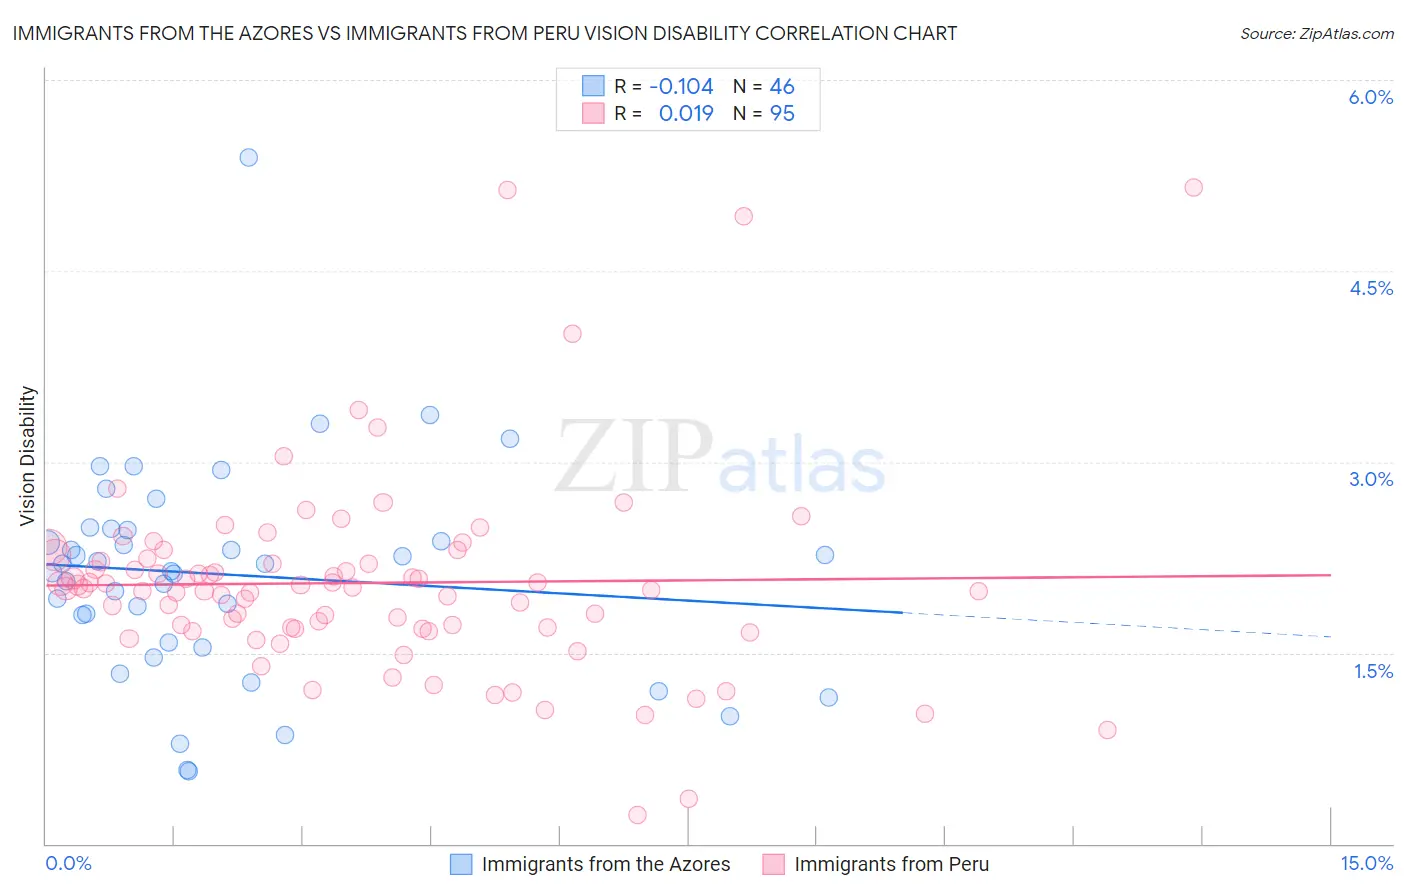
Immigrants from the Azores vs Immigrants from Peru Vision Disability Correlation Chart

The statistical analysis conducted on geographies consisting of 46,255,686 people shows a poor negative correlation between the proportion of Immigrants from the Azores and percentage of population with vision disability in the United States with a correlation coefficient (R) of -0.104 and weighted average of 2.4%. Similarly, the statistical analysis conducted on geographies consisting of 328,732,029 people shows no correlation between the proportion of Immigrants from Peru and percentage of population with vision disability in the United States with a correlation coefficient (R) of 0.019 and weighted average of 2.1%, a difference of 15.2%.
Immigrants from the Azores vs Immigrants from Peru Vision Disability

Vision Disability Correlation Summary

MeasurementImmigrants from the AzoresImmigrants from Peru
Minimum0.57%0.23%
Maximum5.4%5.2%
Range4.8%4.9%
Mean2.1%2.0%
Median2.2%2.0%
Interquartile 25% (IQ1)1.6%1.7%
Interquartile 75% (IQ3)2.5%2.2%
Interquartile Range (IQR)0.89%0.55%
Standard Deviation (Sample)0.85%0.79%
Standard Deviation (Population)0.84%0.78%

Similar Demographics by Vision Disability

Demographics Similar to Immigrants from the Azores by Vision Disability

In terms of vision disability, the demographic groups most similar to Immigrants from the Azores are Spaniard (2.4%, a difference of 0.10%), Celtic (2.4%, a difference of 0.16%), Cuban (2.4%, a difference of 0.16%), Immigrants from Bahamas (2.4%, a difference of 0.43%), and Senegalese (2.4%, a difference of 0.44%).
DemographicsRating | RankVision Disability
Immigrants | Liberia
0.1
/100
|
#264
Tragic
2.4%
Immigrants | Jamaica
0.1
/100
|
#265
Tragic
2.4%
Mexican American Indians
0.1
/100
|
#266
Tragic
2.4%
Ute
0.1
/100
|
#267
Tragic
2.4%
Senegalese
0.1
/100
|
#268
Tragic
2.4%
Celtics
0.1
/100
|
#269
Tragic
2.4%
Cubans
0.1
/100
|
#270
Tragic
2.4%
Immigrants | Azores
0.1
/100
|
#271
Tragic
2.4%
Spaniards
0.1
/100
|
#272
Tragic
2.4%
Immigrants | Bahamas
0.1
/100
|
#273
Tragic
2.4%
Immigrants | Latin America
0.0
/100
|
#274
Tragic
2.4%
Chippewa
0.0
/100
|
#275
Tragic
2.4%
Scotch-Irish
0.0
/100
|
#276
Tragic
2.4%
Bahamians
0.0
/100
|
#277
Tragic
2.4%
Spanish
0.0
/100
|
#278
Tragic
2.4%

Demographics Similar to Immigrants from Peru by Vision Disability

In terms of vision disability, the demographic groups most similar to Immigrants from Peru are Immigrants from Spain (2.1%, a difference of 0.040%), Immigrants from Venezuela (2.1%, a difference of 0.040%), Sudanese (2.1%, a difference of 0.060%), Immigrants from Chile (2.1%, a difference of 0.10%), and Immigrants from Cameroon (2.1%, a difference of 0.13%).
DemographicsRating | RankVision Disability
Immigrants | Uganda
91.4
/100
|
#119
Exceptional
2.1%
Immigrants | Zimbabwe
91.0
/100
|
#120
Exceptional
2.1%
Immigrants | Scotland
90.4
/100
|
#121
Exceptional
2.1%
Immigrants | Ukraine
90.4
/100
|
#122
Exceptional
2.1%
Immigrants | Albania
90.4
/100
|
#123
Exceptional
2.1%
Immigrants | Spain
89.8
/100
|
#124
Excellent
2.1%
Immigrants | Venezuela
89.8
/100
|
#125
Excellent
2.1%
Immigrants | Peru
89.5
/100
|
#126
Excellent
2.1%
Sudanese
89.2
/100
|
#127
Excellent
2.1%
Immigrants | Chile
89.0
/100
|
#128
Excellent
2.1%
Immigrants | Cameroon
88.8
/100
|
#129
Excellent
2.1%
Immigrants | Kenya
88.7
/100
|
#130
Excellent
2.1%
Immigrants | Hungary
88.7
/100
|
#131
Excellent
2.1%
New Zealanders
88.2
/100
|
#132
Excellent
2.1%
Syrians
87.5
/100
|
#133
Excellent
2.1%