Italian vs Immigrants from Peru Vision Disability
COMPARE
Italian
Immigrants from Peru
Vision Disability
Vision Disability Comparison
Italians
Immigrants from Peru
2.1%
VISION DISABILITY
79.7/ 100
METRIC RATING
146th/ 347
METRIC RANK
2.1%
VISION DISABILITY
89.5/ 100
METRIC RATING
126th/ 347
METRIC RANK
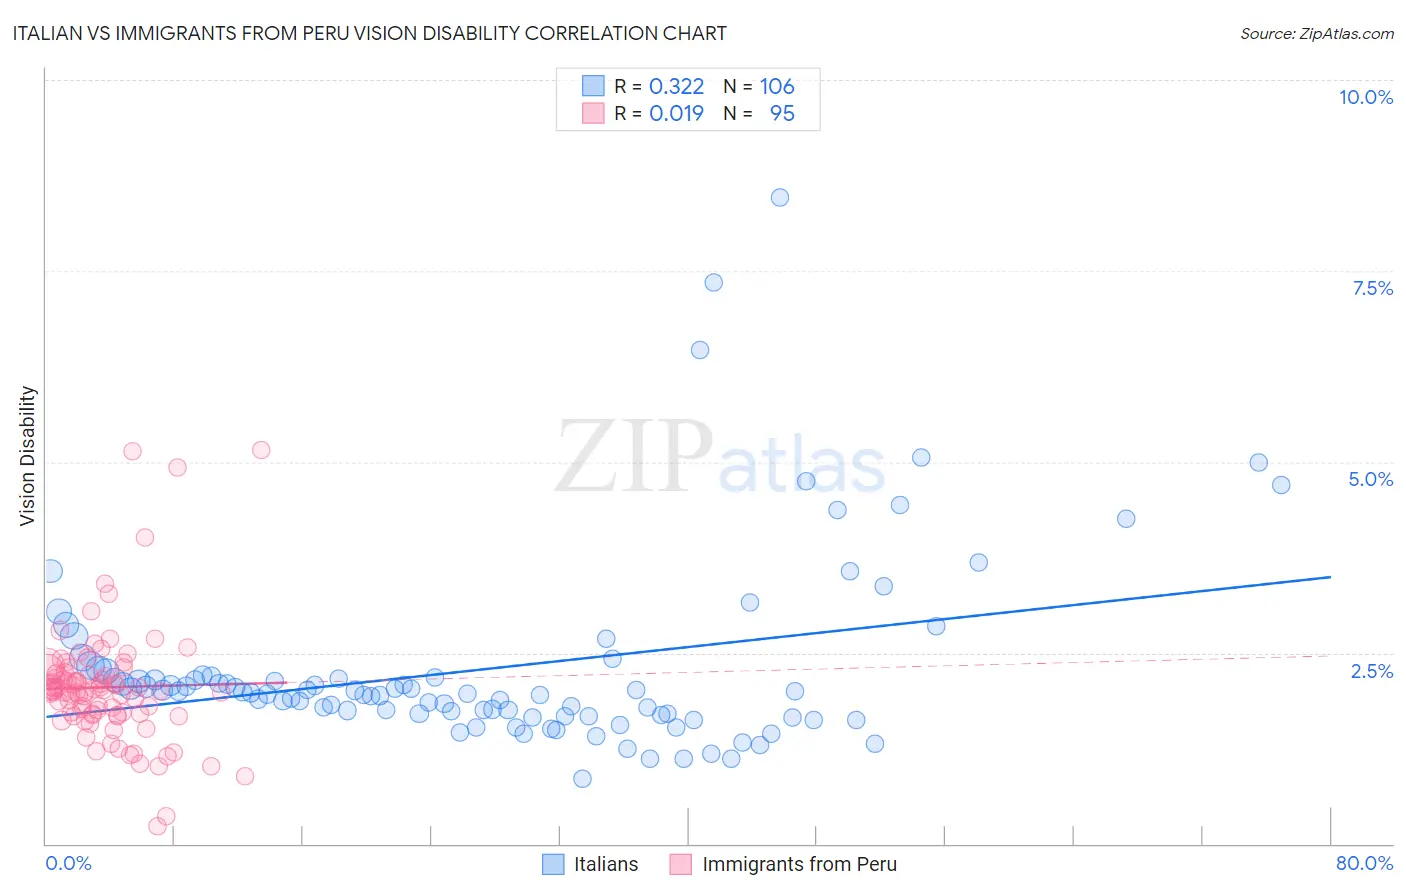
Italian vs Immigrants from Peru Vision Disability Correlation Chart
The statistical analysis conducted on geographies consisting of 572,776,959 people shows a mild positive correlation between the proportion of Italians and percentage of population with vision disability in the United States with a correlation coefficient (R) of 0.322 and weighted average of 2.1%. Similarly, the statistical analysis conducted on geographies consisting of 328,732,029 people shows no correlation between the proportion of Immigrants from Peru and percentage of population with vision disability in the United States with a correlation coefficient (R) of 0.019 and weighted average of 2.1%, a difference of 1.3%.
Vision Disability Correlation Summary
| Measurement | Italian | Immigrants from Peru |
| Minimum | 0.86% | 0.23% |
| Maximum | 8.5% | 5.2% |
| Range | 7.6% | 4.9% |
| Mean | 2.3% | 2.0% |
| Median | 2.0% | 2.0% |
| Interquartile 25% (IQ1) | 1.7% | 1.7% |
| Interquartile 75% (IQ3) | 2.2% | 2.2% |
| Interquartile Range (IQR) | 0.51% | 0.55% |
| Standard Deviation (Sample) | 1.2% | 0.79% |
| Standard Deviation (Population) | 1.2% | 0.78% |
Demographics Similar to Italians and Immigrants from Peru by Vision Disability
In terms of vision disability, the demographic groups most similar to Italians are Immigrants from Bosnia and Herzegovina (2.1%, a difference of 0.18%), Ukrainian (2.1%, a difference of 0.23%), South American (2.1%, a difference of 0.33%), Immigrants from Sierra Leone (2.1%, a difference of 0.33%), and Sierra Leonean (2.1%, a difference of 0.48%). Similarly, the demographic groups most similar to Immigrants from Peru are Sudanese (2.1%, a difference of 0.060%), Immigrants from Chile (2.1%, a difference of 0.10%), Immigrants from Cameroon (2.1%, a difference of 0.13%), Immigrants from Kenya (2.1%, a difference of 0.14%), and Immigrants from Hungary (2.1%, a difference of 0.15%).
| Demographics | Rating | Rank | Vision Disability |
| Immigrants | Peru | 89.5 /100 | #126 | Excellent 2.1% |
| Sudanese | 89.2 /100 | #127 | Excellent 2.1% |
| Immigrants | Chile | 89.0 /100 | #128 | Excellent 2.1% |
| Immigrants | Cameroon | 88.8 /100 | #129 | Excellent 2.1% |
| Immigrants | Kenya | 88.7 /100 | #130 | Excellent 2.1% |
| Immigrants | Hungary | 88.7 /100 | #131 | Excellent 2.1% |
| New Zealanders | 88.2 /100 | #132 | Excellent 2.1% |
| Syrians | 87.5 /100 | #133 | Excellent 2.1% |
| Venezuelans | 87.2 /100 | #134 | Excellent 2.1% |
| Vietnamese | 86.7 /100 | #135 | Excellent 2.1% |
| Czechs | 86.3 /100 | #136 | Excellent 2.1% |
| Immigrants | South Eastern Asia | 86.3 /100 | #137 | Excellent 2.1% |
| Arabs | 86.3 /100 | #138 | Excellent 2.1% |
| Immigrants | Morocco | 85.2 /100 | #139 | Excellent 2.1% |
| Immigrants | Netherlands | 84.2 /100 | #140 | Excellent 2.1% |
| Sierra Leoneans | 84.1 /100 | #141 | Excellent 2.1% |
| South Americans | 82.8 /100 | #142 | Excellent 2.1% |
| Immigrants | Sierra Leone | 82.8 /100 | #143 | Excellent 2.1% |
| Ukrainians | 81.9 /100 | #144 | Excellent 2.1% |
| Immigrants | Bosnia and Herzegovina | 81.5 /100 | #145 | Excellent 2.1% |
| Italians | 79.7 /100 | #146 | Good 2.1% |