Immigrants from the Azores vs Immigrants from Peru 1 or more Vehicles in Household
COMPARE
Immigrants from the Azores
Immigrants from Peru
1 or more Vehicles in Household
1 or more Vehicles in Household Comparison
Immigrants from the Azores
Immigrants from Peru
90.4%
1 OR MORE VEHICLES IN HOUSEHOLD
89.1/ 100
METRIC RATING
127th/ 347
METRIC RANK
88.6%
1 OR MORE VEHICLES IN HOUSEHOLD
4.7/ 100
METRIC RATING
234th/ 347
METRIC RANK
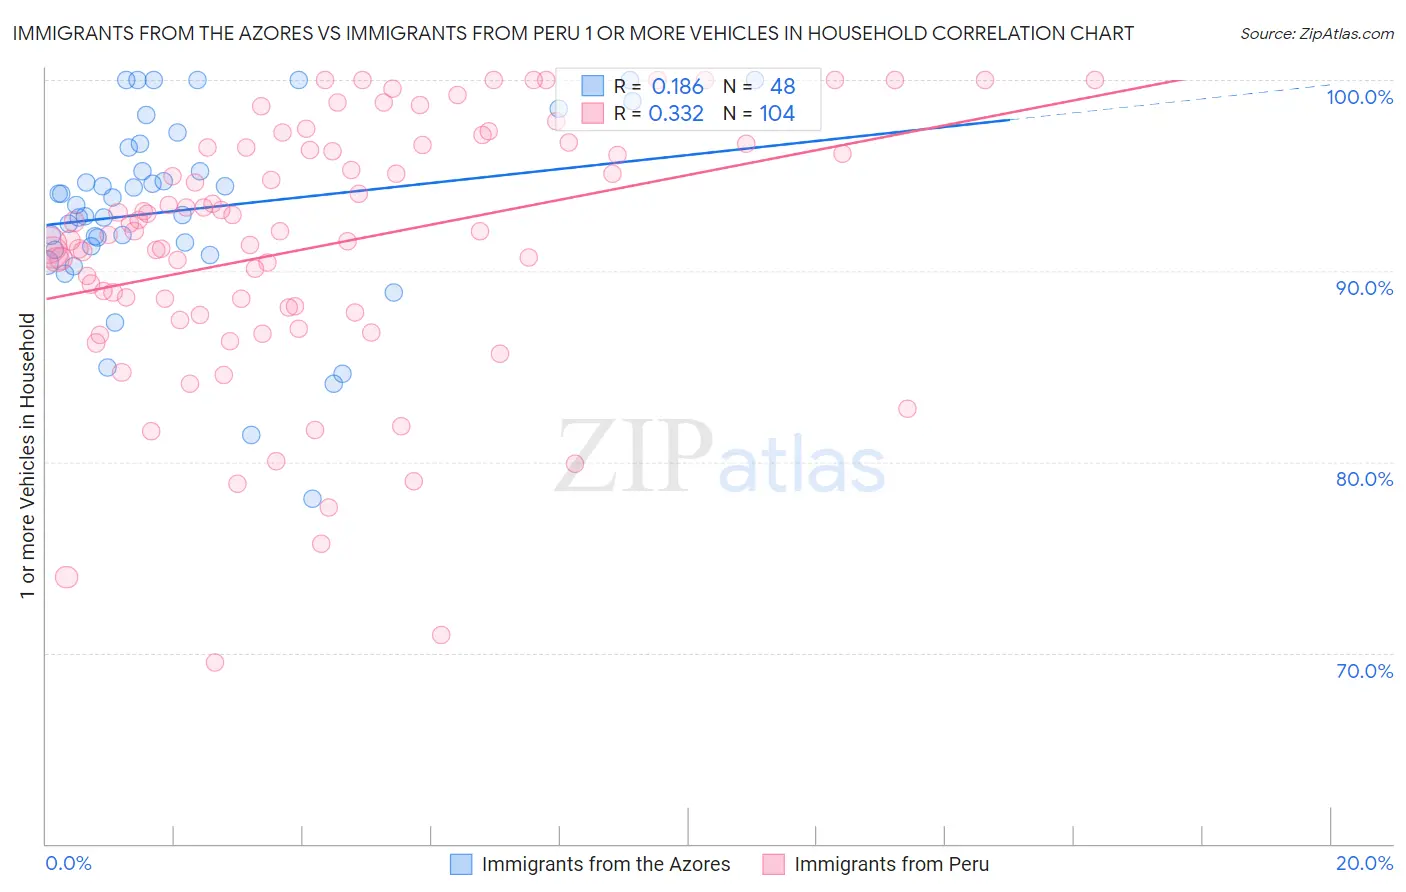
Immigrants from the Azores vs Immigrants from Peru 1 or more Vehicles in Household Correlation Chart
The statistical analysis conducted on geographies consisting of 46,255,729 people shows a poor positive correlation between the proportion of Immigrants from the Azores and percentage of households with 1 or more vehicles available in the United States with a correlation coefficient (R) of 0.186 and weighted average of 90.4%. Similarly, the statistical analysis conducted on geographies consisting of 328,724,512 people shows a mild positive correlation between the proportion of Immigrants from Peru and percentage of households with 1 or more vehicles available in the United States with a correlation coefficient (R) of 0.332 and weighted average of 88.6%, a difference of 2.0%.
1 or more Vehicles in Household Correlation Summary
| Measurement | Immigrants from the Azores | Immigrants from Peru |
| Minimum | 78.1% | 69.5% |
| Maximum | 100.0% | 100.0% |
| Range | 21.9% | 30.5% |
| Mean | 93.2% | 91.3% |
| Median | 93.6% | 92.1% |
| Interquartile 25% (IQ1) | 91.2% | 88.0% |
| Interquartile 75% (IQ3) | 96.6% | 96.5% |
| Interquartile Range (IQR) | 5.4% | 8.5% |
| Standard Deviation (Sample) | 5.0% | 6.7% |
| Standard Deviation (Population) | 4.9% | 6.7% |
Similar Demographics by 1 or more Vehicles in Household
Demographics Similar to Immigrants from the Azores by 1 or more Vehicles in Household
In terms of 1 or more vehicles in household, the demographic groups most similar to Immigrants from the Azores are Burmese (90.4%, a difference of 0.0%), Immigrants from Cameroon (90.4%, a difference of 0.010%), Marshallese (90.4%, a difference of 0.010%), Nicaraguan (90.4%, a difference of 0.010%), and Immigrants from Kenya (90.4%, a difference of 0.020%).
| Demographics | Rating | Rank | 1 or more Vehicles in Household |
| Immigrants | Thailand | 92.3 /100 | #120 | Exceptional 90.6% |
| Icelanders | 92.1 /100 | #121 | Exceptional 90.5% |
| Costa Ricans | 92.0 /100 | #122 | Exceptional 90.5% |
| Fijians | 91.8 /100 | #123 | Exceptional 90.5% |
| Puget Sound Salish | 91.5 /100 | #124 | Exceptional 90.5% |
| Immigrants | Korea | 90.5 /100 | #125 | Exceptional 90.5% |
| Immigrants | Cameroon | 89.4 /100 | #126 | Excellent 90.4% |
| Immigrants | Azores | 89.1 /100 | #127 | Excellent 90.4% |
| Burmese | 89.0 /100 | #128 | Excellent 90.4% |
| Marshallese | 88.9 /100 | #129 | Excellent 90.4% |
| Nicaraguans | 88.8 /100 | #130 | Excellent 90.4% |
| Immigrants | Kenya | 88.5 /100 | #131 | Excellent 90.4% |
| Immigrants | South Africa | 88.1 /100 | #132 | Excellent 90.4% |
| Immigrants | Syria | 87.5 /100 | #133 | Excellent 90.4% |
| Kenyans | 87.0 /100 | #134 | Excellent 90.4% |
Demographics Similar to Immigrants from Peru by 1 or more Vehicles in Household
In terms of 1 or more vehicles in household, the demographic groups most similar to Immigrants from Peru are Paiute (88.6%, a difference of 0.0%), Houma (88.6%, a difference of 0.010%), Immigrants from Japan (88.7%, a difference of 0.020%), Immigrants from Pakistan (88.6%, a difference of 0.020%), and Russian (88.7%, a difference of 0.030%).
| Demographics | Rating | Rank | 1 or more Vehicles in Household |
| Ute | 5.6 /100 | #227 | Tragic 88.7% |
| Immigrants | Norway | 5.5 /100 | #228 | Tragic 88.7% |
| Immigrants | Romania | 5.4 /100 | #229 | Tragic 88.7% |
| Immigrants | Sierra Leone | 5.2 /100 | #230 | Tragic 88.7% |
| Russians | 5.0 /100 | #231 | Tragic 88.7% |
| Immigrants | Japan | 4.9 /100 | #232 | Tragic 88.7% |
| Houma | 4.8 /100 | #233 | Tragic 88.6% |
| Immigrants | Peru | 4.7 /100 | #234 | Tragic 88.6% |
| Paiute | 4.6 /100 | #235 | Tragic 88.6% |
| Immigrants | Pakistan | 4.5 /100 | #236 | Tragic 88.6% |
| Immigrants | Turkey | 4.4 /100 | #237 | Tragic 88.6% |
| Immigrants | Somalia | 4.2 /100 | #238 | Tragic 88.6% |
| Kiowa | 3.8 /100 | #239 | Tragic 88.6% |
| Eastern Europeans | 3.0 /100 | #240 | Tragic 88.5% |
| Taiwanese | 2.6 /100 | #241 | Tragic 88.4% |