Basque vs Immigrants from Peru Disability Age 35 to 64
COMPARE
Basque
Immigrants from Peru
Disability Age 35 to 64
Disability Age 35 to 64 Comparison
Basques
Immigrants from Peru
11.6%
DISABILITY AGE 35 TO 64
19.5/ 100
METRIC RATING
199th/ 347
METRIC RANK
9.8%
DISABILITY AGE 35 TO 64
99.9/ 100
METRIC RATING
45th/ 347
METRIC RANK
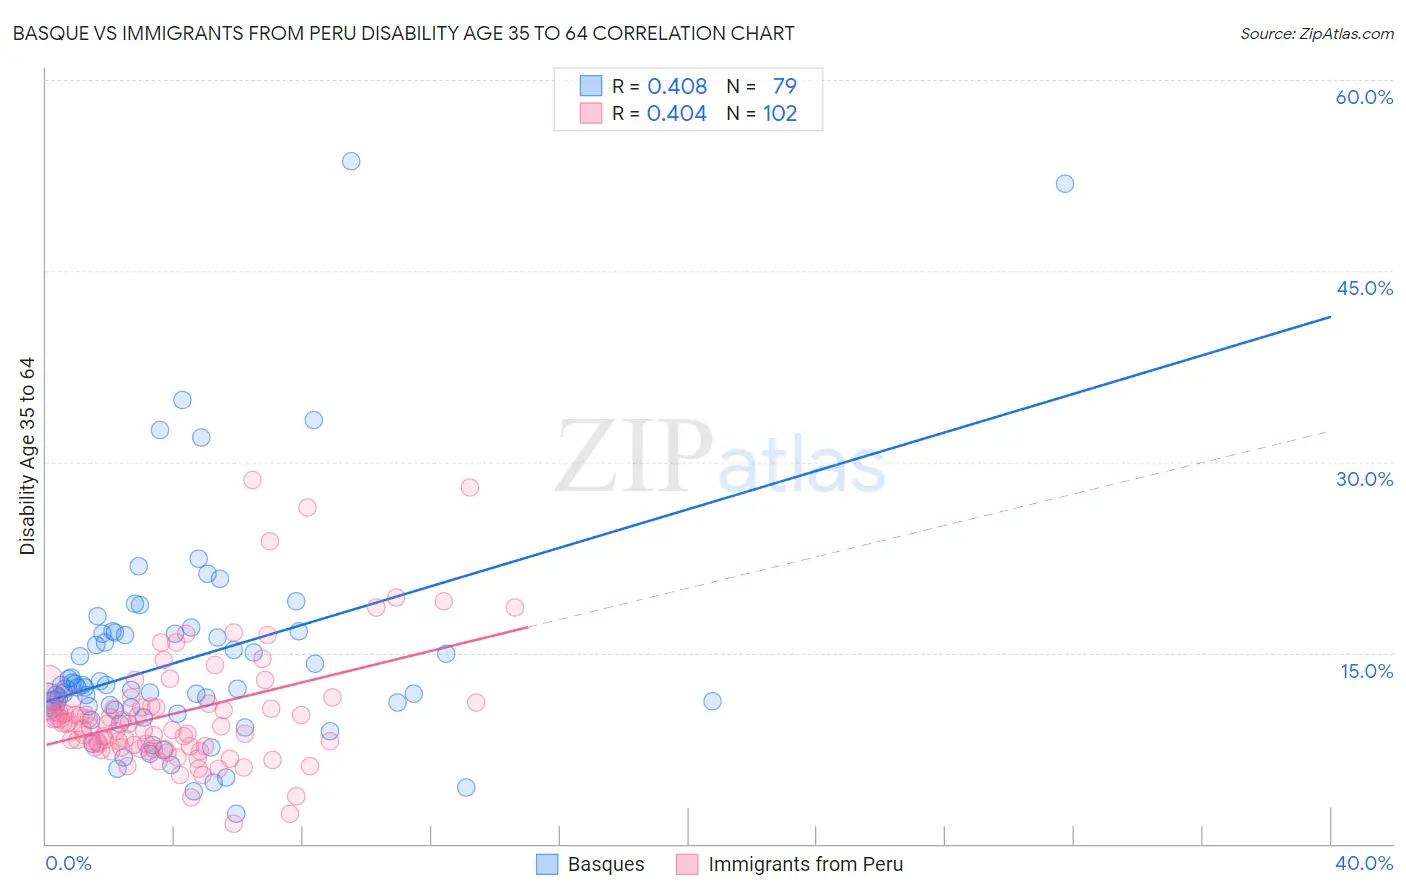
Basque vs Immigrants from Peru Disability Age 35 to 64 Correlation Chart
The statistical analysis conducted on geographies consisting of 165,739,455 people shows a moderate positive correlation between the proportion of Basques and percentage of population with a disability between the ages 34 and 64 in the United States with a correlation coefficient (R) of 0.408 and weighted average of 11.6%. Similarly, the statistical analysis conducted on geographies consisting of 328,733,403 people shows a moderate positive correlation between the proportion of Immigrants from Peru and percentage of population with a disability between the ages 34 and 64 in the United States with a correlation coefficient (R) of 0.404 and weighted average of 9.8%, a difference of 18.4%.
Disability Age 35 to 64 Correlation Summary
| Measurement | Basque | Immigrants from Peru |
| Minimum | 2.4% | 1.6% |
| Maximum | 53.6% | 28.5% |
| Range | 51.2% | 27.0% |
| Mean | 14.4% | 10.3% |
| Median | 12.2% | 9.3% |
| Interquartile 25% (IQ1) | 10.5% | 7.6% |
| Interquartile 75% (IQ3) | 16.5% | 11.0% |
| Interquartile Range (IQR) | 5.9% | 3.4% |
| Standard Deviation (Sample) | 8.8% | 4.7% |
| Standard Deviation (Population) | 8.7% | 4.7% |
Similar Demographics by Disability Age 35 to 64
Demographics Similar to Basques by Disability Age 35 to 64
In terms of disability age 35 to 64, the demographic groups most similar to Basques are Swiss (11.6%, a difference of 0.10%), Immigrants from Panama (11.6%, a difference of 0.11%), Immigrants from Iraq (11.6%, a difference of 0.19%), Immigrants from Kenya (11.6%, a difference of 0.23%), and Immigrants from Guatemala (11.6%, a difference of 0.25%).
| Demographics | Rating | Rank | Disability Age 35 to 64 |
| Norwegians | 29.7 /100 | #192 | Fair 11.5% |
| Immigrants | Africa | 29.0 /100 | #193 | Fair 11.5% |
| Immigrants | Latin America | 27.5 /100 | #194 | Fair 11.5% |
| Carpatho Rusyns | 25.3 /100 | #195 | Fair 11.5% |
| Iraqis | 24.2 /100 | #196 | Fair 11.5% |
| Immigrants | Iraq | 21.0 /100 | #197 | Fair 11.6% |
| Immigrants | Panama | 20.4 /100 | #198 | Fair 11.6% |
| Basques | 19.5 /100 | #199 | Poor 11.6% |
| Swiss | 18.7 /100 | #200 | Poor 11.6% |
| Immigrants | Kenya | 17.7 /100 | #201 | Poor 11.6% |
| Immigrants | Guatemala | 17.5 /100 | #202 | Poor 11.6% |
| British | 17.0 /100 | #203 | Poor 11.6% |
| Nigerians | 16.3 /100 | #204 | Poor 11.6% |
| Slavs | 15.5 /100 | #205 | Poor 11.7% |
| Native Hawaiians | 14.8 /100 | #206 | Poor 11.7% |
Demographics Similar to Immigrants from Peru by Disability Age 35 to 64
In terms of disability age 35 to 64, the demographic groups most similar to Immigrants from Peru are Immigrants from Egypt (9.8%, a difference of 0.060%), Cambodian (9.8%, a difference of 0.18%), Immigrants from Belgium (9.8%, a difference of 0.24%), Immigrants from Serbia (9.8%, a difference of 0.25%), and Immigrants from Greece (9.8%, a difference of 0.29%).
| Demographics | Rating | Rank | Disability Age 35 to 64 |
| Egyptians | 99.9 /100 | #38 | Exceptional 9.7% |
| Immigrants | Belarus | 99.9 /100 | #39 | Exceptional 9.7% |
| Immigrants | Armenia | 99.9 /100 | #40 | Exceptional 9.7% |
| Israelis | 99.9 /100 | #41 | Exceptional 9.7% |
| Immigrants | Malaysia | 99.9 /100 | #42 | Exceptional 9.7% |
| Immigrants | Colombia | 99.9 /100 | #43 | Exceptional 9.8% |
| Immigrants | Egypt | 99.9 /100 | #44 | Exceptional 9.8% |
| Immigrants | Peru | 99.9 /100 | #45 | Exceptional 9.8% |
| Cambodians | 99.8 /100 | #46 | Exceptional 9.8% |
| Immigrants | Belgium | 99.8 /100 | #47 | Exceptional 9.8% |
| Immigrants | Serbia | 99.8 /100 | #48 | Exceptional 9.8% |
| Immigrants | Greece | 99.8 /100 | #49 | Exceptional 9.8% |
| Paraguayans | 99.8 /100 | #50 | Exceptional 9.8% |
| Bhutanese | 99.8 /100 | #51 | Exceptional 9.8% |
| Immigrants | Bulgaria | 99.8 /100 | #52 | Exceptional 9.8% |