Immigrants from the Azores vs Salvadoran Female Disability
COMPARE
Immigrants from the Azores
Salvadoran
Female Disability
Female Disability Comparison
Immigrants from the Azores
Salvadorans
14.9%
FEMALE DISABILITY
0.0/ 100
METRIC RATING
333rd/ 347
METRIC RANK
11.5%
FEMALE DISABILITY
99.8/ 100
METRIC RATING
66th/ 347
METRIC RANK
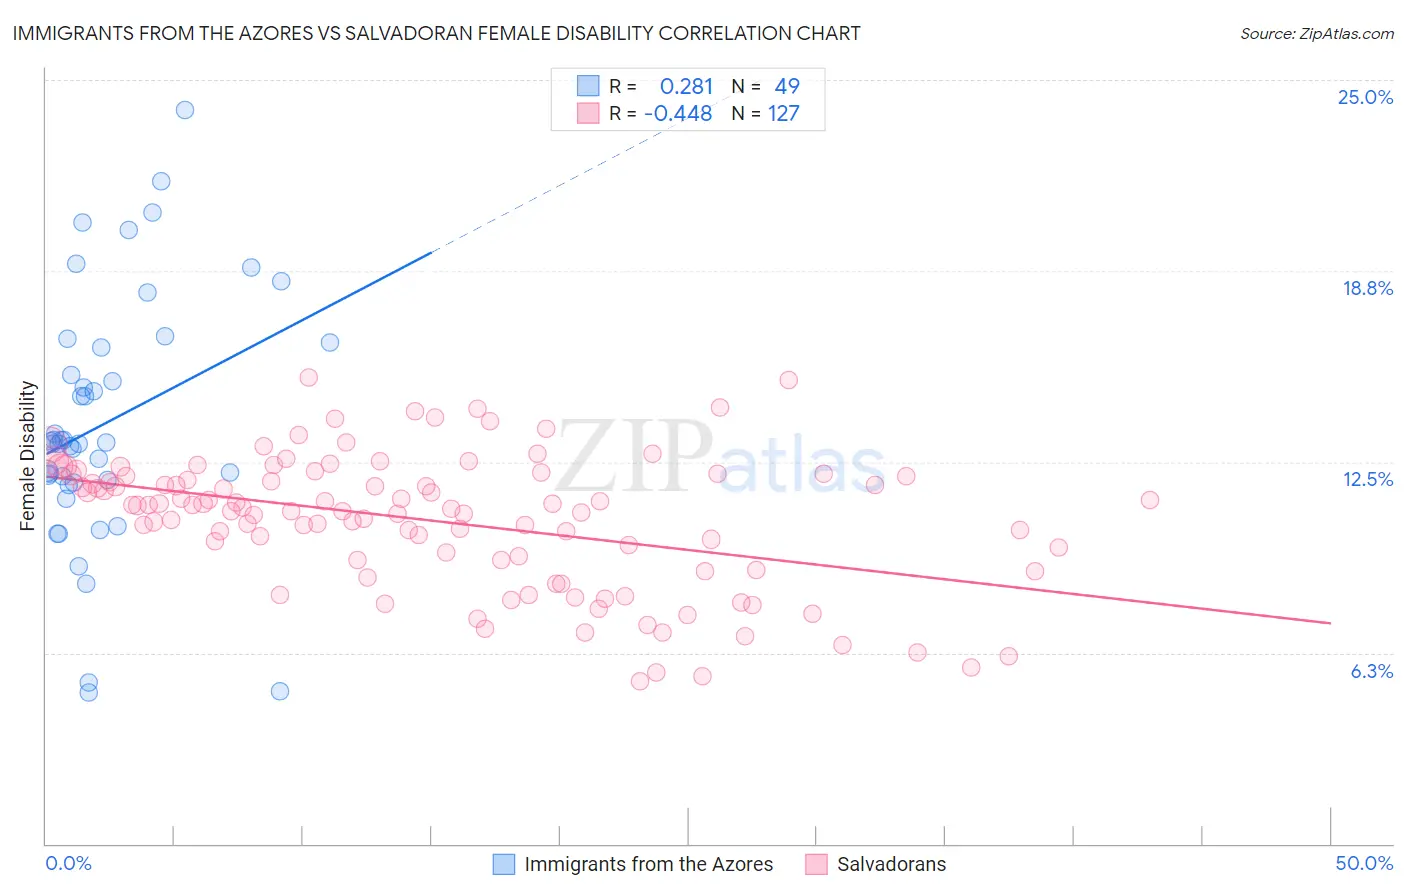
Immigrants from the Azores vs Salvadoran Female Disability Correlation Chart
The statistical analysis conducted on geographies consisting of 46,257,310 people shows a weak positive correlation between the proportion of Immigrants from the Azores and percentage of females with a disability in the United States with a correlation coefficient (R) of 0.281 and weighted average of 14.9%. Similarly, the statistical analysis conducted on geographies consisting of 398,928,715 people shows a moderate negative correlation between the proportion of Salvadorans and percentage of females with a disability in the United States with a correlation coefficient (R) of -0.448 and weighted average of 11.5%, a difference of 29.6%.
Female Disability Correlation Summary
| Measurement | Immigrants from the Azores | Salvadoran |
| Minimum | 5.0% | 5.3% |
| Maximum | 24.0% | 15.3% |
| Range | 19.1% | 9.9% |
| Mean | 13.8% | 10.6% |
| Median | 13.1% | 11.0% |
| Interquartile 25% (IQ1) | 11.9% | 9.3% |
| Interquartile 75% (IQ3) | 16.3% | 12.0% |
| Interquartile Range (IQR) | 4.5% | 2.8% |
| Standard Deviation (Sample) | 4.1% | 2.2% |
| Standard Deviation (Population) | 4.0% | 2.2% |
Similar Demographics by Female Disability
Demographics Similar to Immigrants from the Azores by Female Disability
In terms of female disability, the demographic groups most similar to Immigrants from the Azores are Cherokee (14.9%, a difference of 0.090%), Cajun (14.9%, a difference of 0.11%), Pima (14.8%, a difference of 0.39%), Seminole (15.0%, a difference of 0.79%), and Tohono O'odham (15.0%, a difference of 0.91%).
| Demographics | Rating | Rank | Female Disability |
| Comanche | 0.0 /100 | #326 | Tragic 14.2% |
| Ottawa | 0.0 /100 | #327 | Tragic 14.2% |
| Cape Verdeans | 0.0 /100 | #328 | Tragic 14.2% |
| Osage | 0.0 /100 | #329 | Tragic 14.3% |
| Yuman | 0.0 /100 | #330 | Tragic 14.5% |
| Immigrants | Cabo Verde | 0.0 /100 | #331 | Tragic 14.6% |
| Pima | 0.0 /100 | #332 | Tragic 14.8% |
| Immigrants | Azores | 0.0 /100 | #333 | Tragic 14.9% |
| Cherokee | 0.0 /100 | #334 | Tragic 14.9% |
| Cajuns | 0.0 /100 | #335 | Tragic 14.9% |
| Seminole | 0.0 /100 | #336 | Tragic 15.0% |
| Tohono O'odham | 0.0 /100 | #337 | Tragic 15.0% |
| Dutch West Indians | 0.0 /100 | #338 | Tragic 15.0% |
| Colville | 0.0 /100 | #339 | Tragic 15.1% |
| Chickasaw | 0.0 /100 | #340 | Tragic 15.2% |
Demographics Similar to Salvadorans by Female Disability
In terms of female disability, the demographic groups most similar to Salvadorans are Immigrants from Vietnam (11.5%, a difference of 0.050%), Immigrants from Northern Africa (11.5%, a difference of 0.060%), Colombian (11.5%, a difference of 0.14%), Immigrants from Chile (11.5%, a difference of 0.15%), and Immigrants from South America (11.4%, a difference of 0.17%).
| Demographics | Rating | Rank | Female Disability |
| Immigrants | Spain | 99.9 /100 | #59 | Exceptional 11.4% |
| Immigrants | Bulgaria | 99.9 /100 | #60 | Exceptional 11.4% |
| Immigrants | France | 99.9 /100 | #61 | Exceptional 11.4% |
| Sri Lankans | 99.9 /100 | #62 | Exceptional 11.4% |
| Immigrants | Colombia | 99.9 /100 | #63 | Exceptional 11.4% |
| Immigrants | El Salvador | 99.9 /100 | #64 | Exceptional 11.4% |
| Immigrants | South America | 99.9 /100 | #65 | Exceptional 11.4% |
| Salvadorans | 99.8 /100 | #66 | Exceptional 11.5% |
| Immigrants | Vietnam | 99.8 /100 | #67 | Exceptional 11.5% |
| Immigrants | Northern Africa | 99.8 /100 | #68 | Exceptional 11.5% |
| Colombians | 99.8 /100 | #69 | Exceptional 11.5% |
| Immigrants | Chile | 99.8 /100 | #70 | Exceptional 11.5% |
| Immigrants | Ireland | 99.8 /100 | #71 | Exceptional 11.5% |
| Chileans | 99.8 /100 | #72 | Exceptional 11.5% |
| Immigrants | Switzerland | 99.8 /100 | #73 | Exceptional 11.5% |