Immigrants from Argentina vs Spanish Disability Age 35 to 64
COMPARE
Immigrants from Argentina
Spanish
Disability Age 35 to 64
Disability Age 35 to 64 Comparison
Immigrants from Argentina
Spanish
9.3%
DISABILITY AGE 35 TO 64
100.0/ 100
METRIC RATING
20th/ 347
METRIC RANK
12.7%
DISABILITY AGE 35 TO 64
0.2/ 100
METRIC RATING
269th/ 347
METRIC RANK
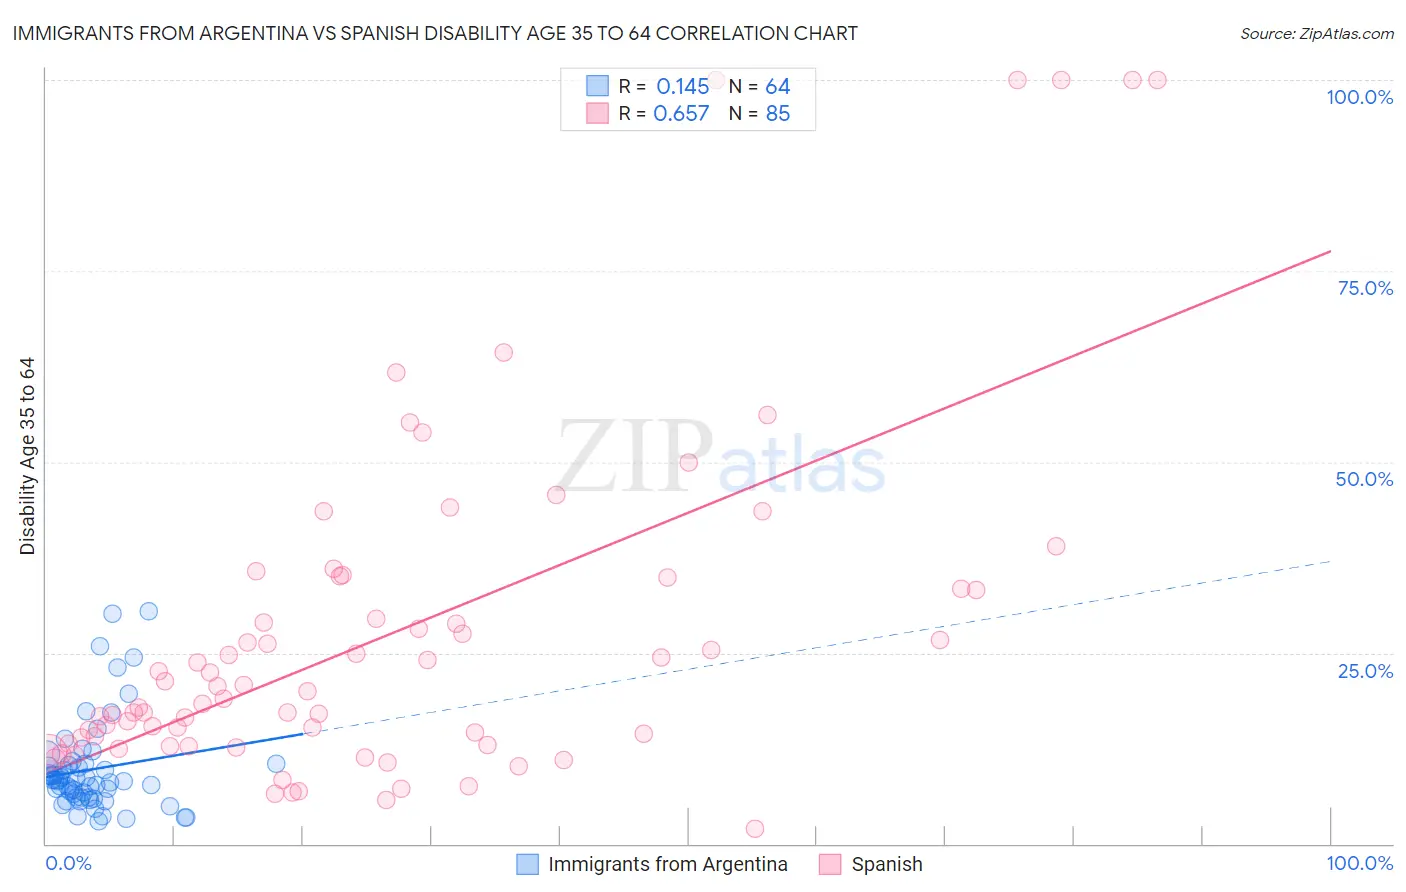
Immigrants from Argentina vs Spanish Disability Age 35 to 64 Correlation Chart
The statistical analysis conducted on geographies consisting of 264,341,795 people shows a poor positive correlation between the proportion of Immigrants from Argentina and percentage of population with a disability between the ages 34 and 64 in the United States with a correlation coefficient (R) of 0.145 and weighted average of 9.3%. Similarly, the statistical analysis conducted on geographies consisting of 421,846,574 people shows a significant positive correlation between the proportion of Spanish and percentage of population with a disability between the ages 34 and 64 in the United States with a correlation coefficient (R) of 0.657 and weighted average of 12.7%, a difference of 36.0%.
Disability Age 35 to 64 Correlation Summary
| Measurement | Immigrants from Argentina | Spanish |
| Minimum | 3.0% | 2.0% |
| Maximum | 30.4% | 100.0% |
| Range | 27.4% | 98.0% |
| Mean | 9.7% | 27.5% |
| Median | 8.3% | 19.9% |
| Interquartile 25% (IQ1) | 6.1% | 13.1% |
| Interquartile 75% (IQ3) | 10.3% | 34.1% |
| Interquartile Range (IQR) | 4.2% | 21.1% |
| Standard Deviation (Sample) | 6.0% | 22.7% |
| Standard Deviation (Population) | 6.0% | 22.5% |
Similar Demographics by Disability Age 35 to 64
Demographics Similar to Immigrants from Argentina by Disability Age 35 to 64
In terms of disability age 35 to 64, the demographic groups most similar to Immigrants from Argentina are Okinawan (9.4%, a difference of 0.43%), Cypriot (9.4%, a difference of 0.46%), Immigrants from Venezuela (9.3%, a difference of 0.51%), Argentinean (9.4%, a difference of 0.68%), and Asian (9.4%, a difference of 0.69%).
| Demographics | Rating | Rank | Disability Age 35 to 64 |
| Immigrants | South Central Asia | 100.0 /100 | #13 | Exceptional 8.9% |
| Immigrants | Singapore | 100.0 /100 | #14 | Exceptional 8.9% |
| Bolivians | 100.0 /100 | #15 | Exceptional 8.9% |
| Immigrants | Korea | 100.0 /100 | #16 | Exceptional 9.0% |
| Burmese | 100.0 /100 | #17 | Exceptional 9.2% |
| Soviet Union | 100.0 /100 | #18 | Exceptional 9.2% |
| Immigrants | Venezuela | 100.0 /100 | #19 | Exceptional 9.3% |
| Immigrants | Argentina | 100.0 /100 | #20 | Exceptional 9.3% |
| Okinawans | 100.0 /100 | #21 | Exceptional 9.4% |
| Cypriots | 100.0 /100 | #22 | Exceptional 9.4% |
| Argentineans | 100.0 /100 | #23 | Exceptional 9.4% |
| Asians | 100.0 /100 | #24 | Exceptional 9.4% |
| Venezuelans | 100.0 /100 | #25 | Exceptional 9.4% |
| Immigrants | Sri Lanka | 100.0 /100 | #26 | Exceptional 9.5% |
| Immigrants | Asia | 100.0 /100 | #27 | Exceptional 9.5% |
Demographics Similar to Spanish by Disability Age 35 to 64
In terms of disability age 35 to 64, the demographic groups most similar to Spanish are French (12.7%, a difference of 0.040%), Immigrants from Dominica (12.7%, a difference of 0.10%), Subsaharan African (12.6%, a difference of 0.28%), White/Caucasian (12.6%, a difference of 0.44%), and Nepalese (12.8%, a difference of 1.1%).
| Demographics | Rating | Rank | Disability Age 35 to 64 |
| Senegalese | 0.5 /100 | #262 | Tragic 12.5% |
| Immigrants | Zaire | 0.4 /100 | #263 | Tragic 12.5% |
| Immigrants | Portugal | 0.4 /100 | #264 | Tragic 12.5% |
| Marshallese | 0.4 /100 | #265 | Tragic 12.5% |
| Whites/Caucasians | 0.3 /100 | #266 | Tragic 12.6% |
| Sub-Saharan Africans | 0.2 /100 | #267 | Tragic 12.6% |
| Immigrants | Dominica | 0.2 /100 | #268 | Tragic 12.7% |
| Spanish | 0.2 /100 | #269 | Tragic 12.7% |
| French | 0.2 /100 | #270 | Tragic 12.7% |
| Nepalese | 0.1 /100 | #271 | Tragic 12.8% |
| U.S. Virgin Islanders | 0.1 /100 | #272 | Tragic 12.8% |
| Pennsylvania Germans | 0.1 /100 | #273 | Tragic 12.8% |
| Celtics | 0.1 /100 | #274 | Tragic 12.9% |
| Dominicans | 0.1 /100 | #275 | Tragic 12.9% |
| Somalis | 0.1 /100 | #276 | Tragic 12.9% |