Immigrants from Argentina vs Ugandan Disability Age 35 to 64
COMPARE
Immigrants from Argentina
Ugandan
Disability Age 35 to 64
Disability Age 35 to 64 Comparison
Immigrants from Argentina
Ugandans
9.3%
DISABILITY AGE 35 TO 64
100.0/ 100
METRIC RATING
20th/ 347
METRIC RANK
11.3%
DISABILITY AGE 35 TO 64
43.7/ 100
METRIC RATING
176th/ 347
METRIC RANK
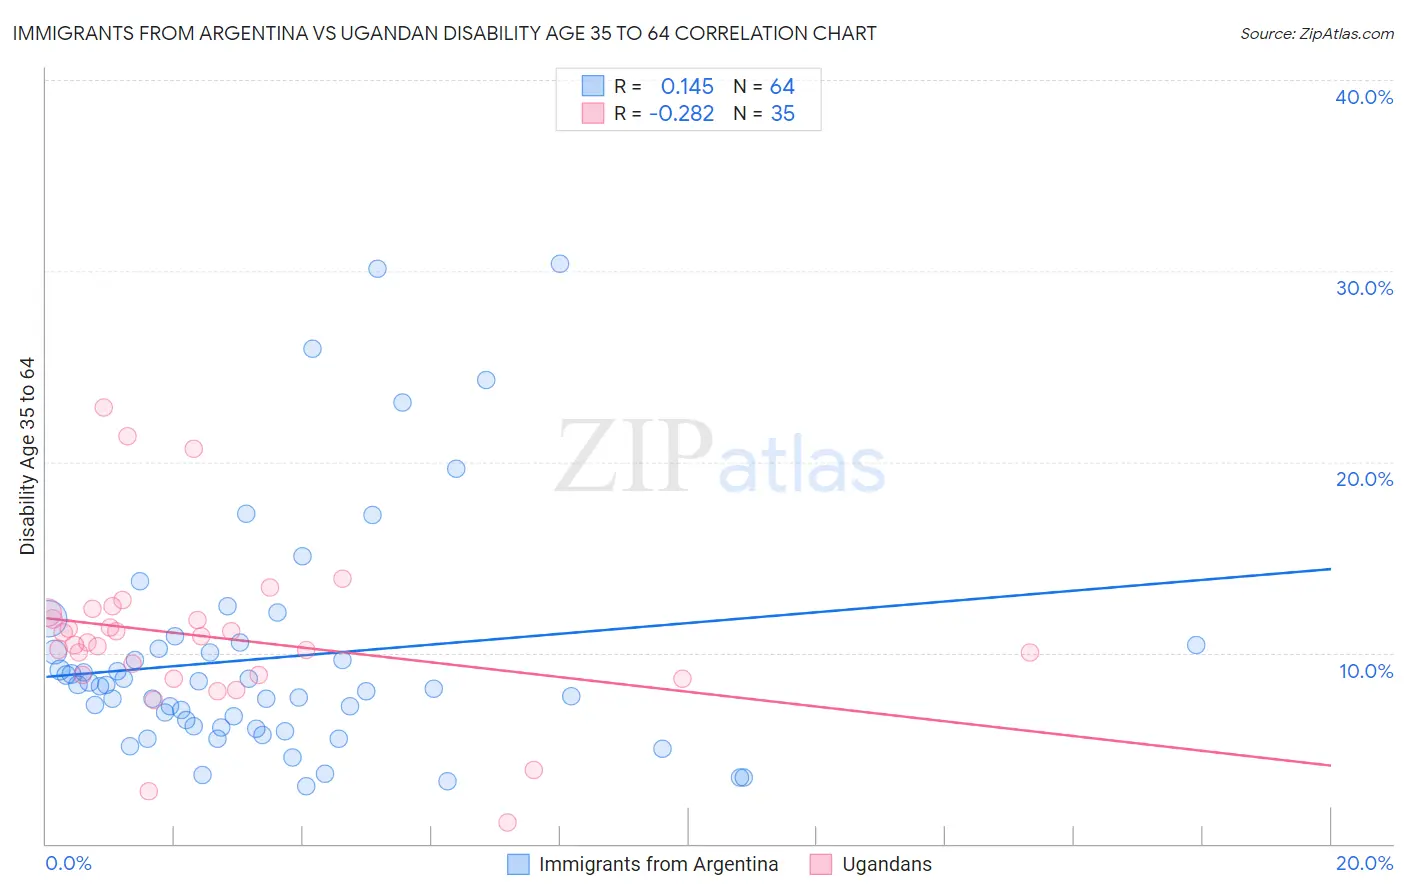
Immigrants from Argentina vs Ugandan Disability Age 35 to 64 Correlation Chart
The statistical analysis conducted on geographies consisting of 264,341,795 people shows a poor positive correlation between the proportion of Immigrants from Argentina and percentage of population with a disability between the ages 34 and 64 in the United States with a correlation coefficient (R) of 0.145 and weighted average of 9.3%. Similarly, the statistical analysis conducted on geographies consisting of 93,995,373 people shows a weak negative correlation between the proportion of Ugandans and percentage of population with a disability between the ages 34 and 64 in the United States with a correlation coefficient (R) of -0.282 and weighted average of 11.3%, a difference of 21.6%.
Disability Age 35 to 64 Correlation Summary
| Measurement | Immigrants from Argentina | Ugandan |
| Minimum | 3.0% | 1.1% |
| Maximum | 30.4% | 22.8% |
| Range | 27.4% | 21.7% |
| Mean | 9.7% | 10.8% |
| Median | 8.3% | 10.5% |
| Interquartile 25% (IQ1) | 6.1% | 8.8% |
| Interquartile 75% (IQ3) | 10.3% | 12.1% |
| Interquartile Range (IQR) | 4.2% | 3.3% |
| Standard Deviation (Sample) | 6.0% | 4.3% |
| Standard Deviation (Population) | 6.0% | 4.3% |
Similar Demographics by Disability Age 35 to 64
Demographics Similar to Immigrants from Argentina by Disability Age 35 to 64
In terms of disability age 35 to 64, the demographic groups most similar to Immigrants from Argentina are Okinawan (9.4%, a difference of 0.43%), Cypriot (9.4%, a difference of 0.46%), Immigrants from Venezuela (9.3%, a difference of 0.51%), Argentinean (9.4%, a difference of 0.68%), and Asian (9.4%, a difference of 0.69%).
| Demographics | Rating | Rank | Disability Age 35 to 64 |
| Immigrants | South Central Asia | 100.0 /100 | #13 | Exceptional 8.9% |
| Immigrants | Singapore | 100.0 /100 | #14 | Exceptional 8.9% |
| Bolivians | 100.0 /100 | #15 | Exceptional 8.9% |
| Immigrants | Korea | 100.0 /100 | #16 | Exceptional 9.0% |
| Burmese | 100.0 /100 | #17 | Exceptional 9.2% |
| Soviet Union | 100.0 /100 | #18 | Exceptional 9.2% |
| Immigrants | Venezuela | 100.0 /100 | #19 | Exceptional 9.3% |
| Immigrants | Argentina | 100.0 /100 | #20 | Exceptional 9.3% |
| Okinawans | 100.0 /100 | #21 | Exceptional 9.4% |
| Cypriots | 100.0 /100 | #22 | Exceptional 9.4% |
| Argentineans | 100.0 /100 | #23 | Exceptional 9.4% |
| Asians | 100.0 /100 | #24 | Exceptional 9.4% |
| Venezuelans | 100.0 /100 | #25 | Exceptional 9.4% |
| Immigrants | Sri Lanka | 100.0 /100 | #26 | Exceptional 9.5% |
| Immigrants | Asia | 100.0 /100 | #27 | Exceptional 9.5% |
Demographics Similar to Ugandans by Disability Age 35 to 64
In terms of disability age 35 to 64, the demographic groups most similar to Ugandans are Immigrants from Eastern Africa (11.3%, a difference of 0.12%), Polish (11.3%, a difference of 0.14%), Immigrants from Barbados (11.3%, a difference of 0.18%), Immigrants from Caribbean (11.3%, a difference of 0.18%), and Trinidadian and Tobagonian (11.4%, a difference of 0.24%).
| Demographics | Rating | Rank | Disability Age 35 to 64 |
| Haitians | 59.0 /100 | #169 | Average 11.2% |
| Immigrants | Uganda | 58.0 /100 | #170 | Average 11.2% |
| Immigrants | Trinidad and Tobago | 55.9 /100 | #171 | Average 11.2% |
| Italians | 55.6 /100 | #172 | Average 11.2% |
| Lebanese | 51.8 /100 | #173 | Average 11.3% |
| Immigrants | Fiji | 50.0 /100 | #174 | Average 11.3% |
| Czechs | 47.9 /100 | #175 | Average 11.3% |
| Ugandans | 43.7 /100 | #176 | Average 11.3% |
| Immigrants | Eastern Africa | 42.2 /100 | #177 | Average 11.3% |
| Poles | 42.0 /100 | #178 | Average 11.3% |
| Immigrants | Barbados | 41.6 /100 | #179 | Average 11.3% |
| Immigrants | Caribbean | 41.5 /100 | #180 | Average 11.3% |
| Trinidadians and Tobagonians | 40.8 /100 | #181 | Average 11.4% |
| Icelanders | 39.7 /100 | #182 | Fair 11.4% |
| Immigrants | Oceania | 39.5 /100 | #183 | Fair 11.4% |