Icelander vs Immigrants from Portugal Male Disability
COMPARE
Icelander
Immigrants from Portugal
Male Disability
Male Disability Comparison
Icelanders
Immigrants from Portugal
11.6%
MALE DISABILITY
10.1/ 100
METRIC RATING
208th/ 347
METRIC RANK
12.3%
MALE DISABILITY
0.1/ 100
METRIC RATING
265th/ 347
METRIC RANK
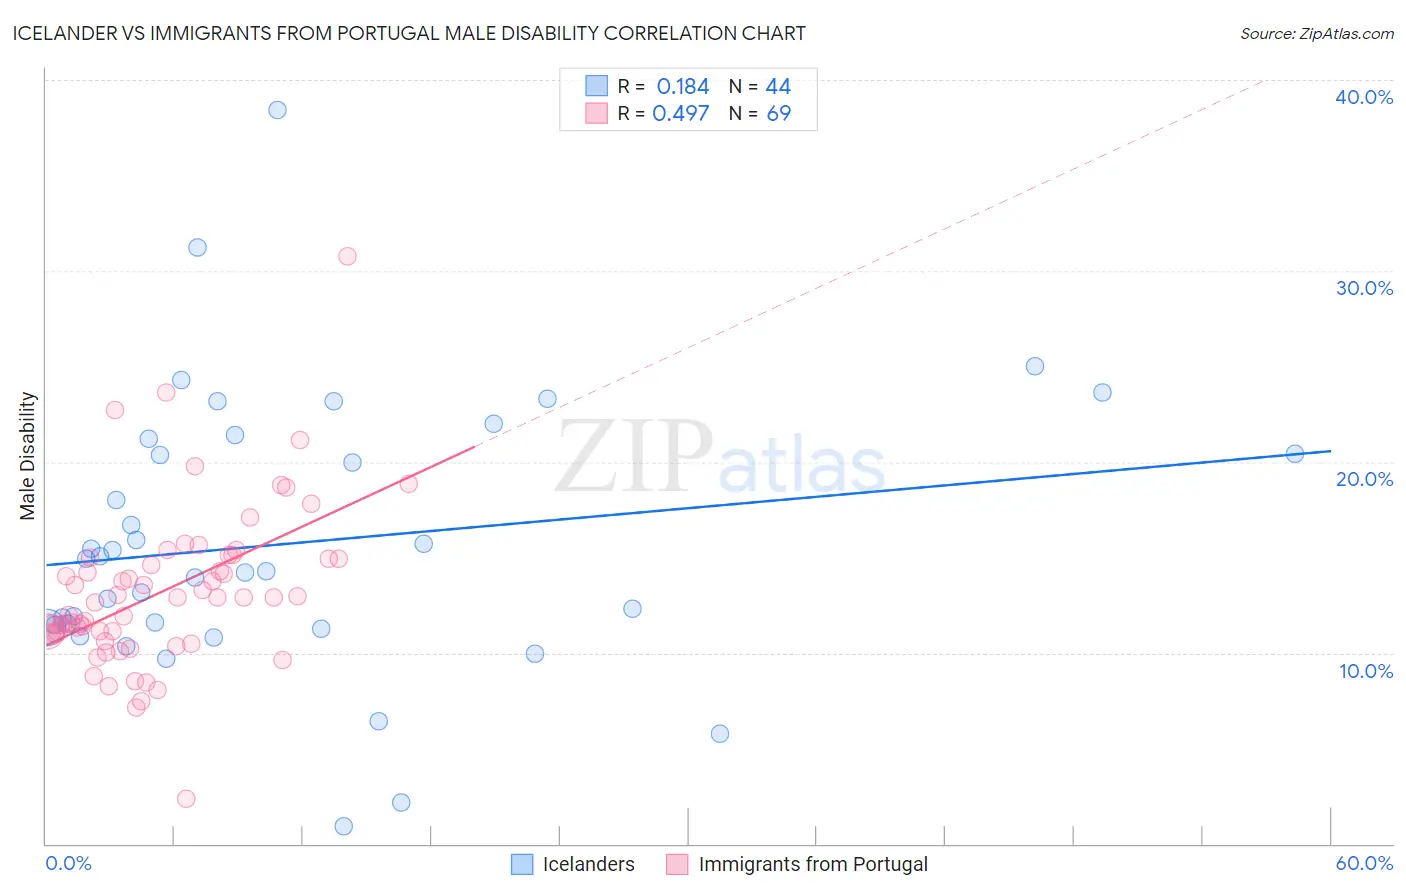
Icelander vs Immigrants from Portugal Male Disability Correlation Chart
The statistical analysis conducted on geographies consisting of 159,644,082 people shows a poor positive correlation between the proportion of Icelanders and percentage of males with a disability in the United States with a correlation coefficient (R) of 0.184 and weighted average of 11.6%. Similarly, the statistical analysis conducted on geographies consisting of 174,781,482 people shows a moderate positive correlation between the proportion of Immigrants from Portugal and percentage of males with a disability in the United States with a correlation coefficient (R) of 0.497 and weighted average of 12.3%, a difference of 6.1%.
Male Disability Correlation Summary
| Measurement | Icelander | Immigrants from Portugal |
| Minimum | 0.92% | 2.4% |
| Maximum | 38.5% | 30.8% |
| Range | 37.5% | 28.4% |
| Mean | 15.8% | 13.2% |
| Median | 14.6% | 12.9% |
| Interquartile 25% (IQ1) | 11.4% | 11.0% |
| Interquartile 75% (IQ3) | 20.8% | 15.0% |
| Interquartile Range (IQR) | 9.4% | 3.9% |
| Standard Deviation (Sample) | 7.2% | 4.2% |
| Standard Deviation (Population) | 7.1% | 4.2% |
Similar Demographics by Male Disability
Demographics Similar to Icelanders by Male Disability
In terms of male disability, the demographic groups most similar to Icelanders are Spanish American Indian (11.6%, a difference of 0.010%), Immigrants from Somalia (11.5%, a difference of 0.040%), Ukrainian (11.5%, a difference of 0.070%), Serbian (11.5%, a difference of 0.080%), and Immigrants from Cambodia (11.5%, a difference of 0.090%).
| Demographics | Rating | Rank | Male Disability |
| Immigrants | Panama | 13.0 /100 | #201 | Poor 11.5% |
| Immigrants | Mexico | 12.6 /100 | #202 | Poor 11.5% |
| Jamaicans | 10.9 /100 | #203 | Poor 11.5% |
| Immigrants | Cambodia | 10.8 /100 | #204 | Poor 11.5% |
| Serbians | 10.7 /100 | #205 | Poor 11.5% |
| Ukrainians | 10.6 /100 | #206 | Poor 11.5% |
| Immigrants | Somalia | 10.4 /100 | #207 | Poor 11.5% |
| Icelanders | 10.1 /100 | #208 | Poor 11.6% |
| Spanish American Indians | 10.1 /100 | #209 | Poor 11.6% |
| Ute | 9.4 /100 | #210 | Tragic 11.6% |
| Immigrants | Thailand | 8.4 /100 | #211 | Tragic 11.6% |
| Immigrants | Scotland | 8.2 /100 | #212 | Tragic 11.6% |
| Mexican American Indians | 7.8 /100 | #213 | Tragic 11.6% |
| Lithuanians | 6.6 /100 | #214 | Tragic 11.6% |
| Indonesians | 5.9 /100 | #215 | Tragic 11.6% |
Demographics Similar to Immigrants from Portugal by Male Disability
In terms of male disability, the demographic groups most similar to Immigrants from Portugal are Hawaiian (12.3%, a difference of 0.020%), Immigrants from Germany (12.3%, a difference of 0.070%), Portuguese (12.3%, a difference of 0.19%), Czechoslovakian (12.3%, a difference of 0.19%), and Spaniard (12.3%, a difference of 0.28%).
| Demographics | Rating | Rank | Male Disability |
| Basques | 0.3 /100 | #258 | Tragic 12.1% |
| Belgians | 0.3 /100 | #259 | Tragic 12.1% |
| Swedes | 0.3 /100 | #260 | Tragic 12.1% |
| Slavs | 0.2 /100 | #261 | Tragic 12.2% |
| Norwegians | 0.2 /100 | #262 | Tragic 12.2% |
| Canadians | 0.2 /100 | #263 | Tragic 12.2% |
| Nepalese | 0.2 /100 | #264 | Tragic 12.2% |
| Immigrants | Portugal | 0.1 /100 | #265 | Tragic 12.3% |
| Hawaiians | 0.1 /100 | #266 | Tragic 12.3% |
| Immigrants | Germany | 0.1 /100 | #267 | Tragic 12.3% |
| Portuguese | 0.1 /100 | #268 | Tragic 12.3% |
| Czechoslovakians | 0.1 /100 | #269 | Tragic 12.3% |
| Spaniards | 0.1 /100 | #270 | Tragic 12.3% |
| Scandinavians | 0.1 /100 | #271 | Tragic 12.3% |
| Hmong | 0.0 /100 | #272 | Tragic 12.5% |