Hungarian vs South American Disability Age 65 to 74
COMPARE
Hungarian
South American
Disability Age 65 to 74
Disability Age 65 to 74 Comparison
Hungarians
South Americans
22.4%
DISABILITY AGE 65 TO 74
93.3/ 100
METRIC RATING
123rd/ 347
METRIC RANK
22.2%
DISABILITY AGE 65 TO 74
96.4/ 100
METRIC RATING
103rd/ 347
METRIC RANK
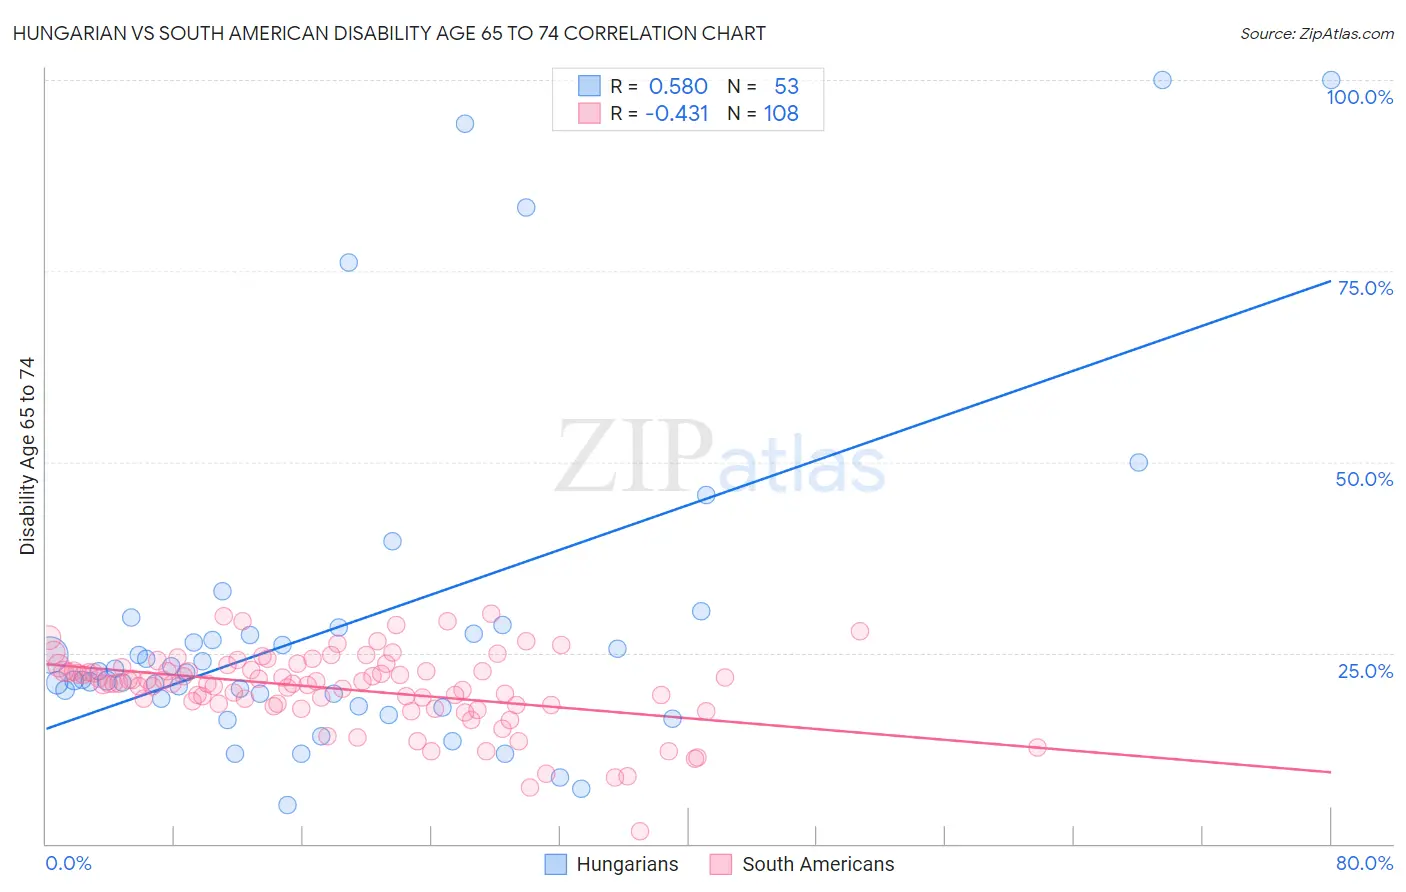
Hungarian vs South American Disability Age 65 to 74 Correlation Chart
The statistical analysis conducted on geographies consisting of 484,991,296 people shows a substantial positive correlation between the proportion of Hungarians and percentage of population with a disability between the ages 65 and 75 in the United States with a correlation coefficient (R) of 0.580 and weighted average of 22.4%. Similarly, the statistical analysis conducted on geographies consisting of 492,506,151 people shows a moderate negative correlation between the proportion of South Americans and percentage of population with a disability between the ages 65 and 75 in the United States with a correlation coefficient (R) of -0.431 and weighted average of 22.2%, a difference of 0.99%.
Disability Age 65 to 74 Correlation Summary
| Measurement | Hungarian | South American |
| Minimum | 5.1% | 1.6% |
| Maximum | 100.0% | 30.2% |
| Range | 94.9% | 28.6% |
| Mean | 28.7% | 20.3% |
| Median | 22.4% | 21.0% |
| Interquartile 25% (IQ1) | 18.5% | 18.2% |
| Interquartile 75% (IQ3) | 27.9% | 22.9% |
| Interquartile Range (IQR) | 9.3% | 4.6% |
| Standard Deviation (Sample) | 22.0% | 5.0% |
| Standard Deviation (Population) | 21.8% | 5.0% |
Demographics Similar to Hungarians and South Americans by Disability Age 65 to 74
In terms of disability age 65 to 74, the demographic groups most similar to Hungarians are Czech (22.4%, a difference of 0.050%), Immigrants from Jordan (22.4%, a difference of 0.050%), Immigrants from Kazakhstan (22.4%, a difference of 0.15%), Immigrants from Northern Africa (22.4%, a difference of 0.37%), and Swedish (22.4%, a difference of 0.38%). Similarly, the demographic groups most similar to South Americans are Colombian (22.2%, a difference of 0.010%), Palestinian (22.2%, a difference of 0.050%), Peruvian (22.2%, a difference of 0.12%), Slovene (22.2%, a difference of 0.12%), and Immigrants from Zimbabwe (22.3%, a difference of 0.13%).
| Demographics | Rating | Rank | Disability Age 65 to 74 |
| South Americans | 96.4 /100 | #103 | Exceptional 22.2% |
| Colombians | 96.4 /100 | #104 | Exceptional 22.2% |
| Palestinians | 96.3 /100 | #105 | Exceptional 22.2% |
| Peruvians | 96.1 /100 | #106 | Exceptional 22.2% |
| Slovenes | 96.1 /100 | #107 | Exceptional 22.2% |
| Immigrants | Zimbabwe | 96.1 /100 | #108 | Exceptional 22.3% |
| Albanians | 95.8 /100 | #109 | Exceptional 22.3% |
| Immigrants | Peru | 95.7 /100 | #110 | Exceptional 22.3% |
| Serbians | 95.7 /100 | #111 | Exceptional 22.3% |
| Immigrants | South America | 95.5 /100 | #112 | Exceptional 22.3% |
| Syrians | 95.3 /100 | #113 | Exceptional 22.3% |
| Ukrainians | 95.1 /100 | #114 | Exceptional 22.3% |
| Laotians | 94.9 /100 | #115 | Exceptional 22.3% |
| Brazilians | 94.8 /100 | #116 | Exceptional 22.4% |
| Swedes | 94.7 /100 | #117 | Exceptional 22.4% |
| Austrians | 94.7 /100 | #118 | Exceptional 22.4% |
| Immigrants | Northern Africa | 94.7 /100 | #119 | Exceptional 22.4% |
| Immigrants | Kazakhstan | 93.9 /100 | #120 | Exceptional 22.4% |
| Czechs | 93.5 /100 | #121 | Exceptional 22.4% |
| Immigrants | Jordan | 93.5 /100 | #122 | Exceptional 22.4% |
| Hungarians | 93.3 /100 | #123 | Exceptional 22.4% |