Hungarian vs South American Unemployment Among Ages 65 to 74 years
COMPARE
Hungarian
South American
Unemployment Among Ages 65 to 74 years
Unemployment Among Ages 65 to 74 years Comparison
Hungarians
South Americans
5.5%
UNEMPLOYMENT AMONG AGES 65 TO 74 YEARS
4.4/ 100
METRIC RATING
223rd/ 347
METRIC RANK
5.6%
UNEMPLOYMENT AMONG AGES 65 TO 74 YEARS
0.2/ 100
METRIC RATING
261st/ 347
METRIC RANK
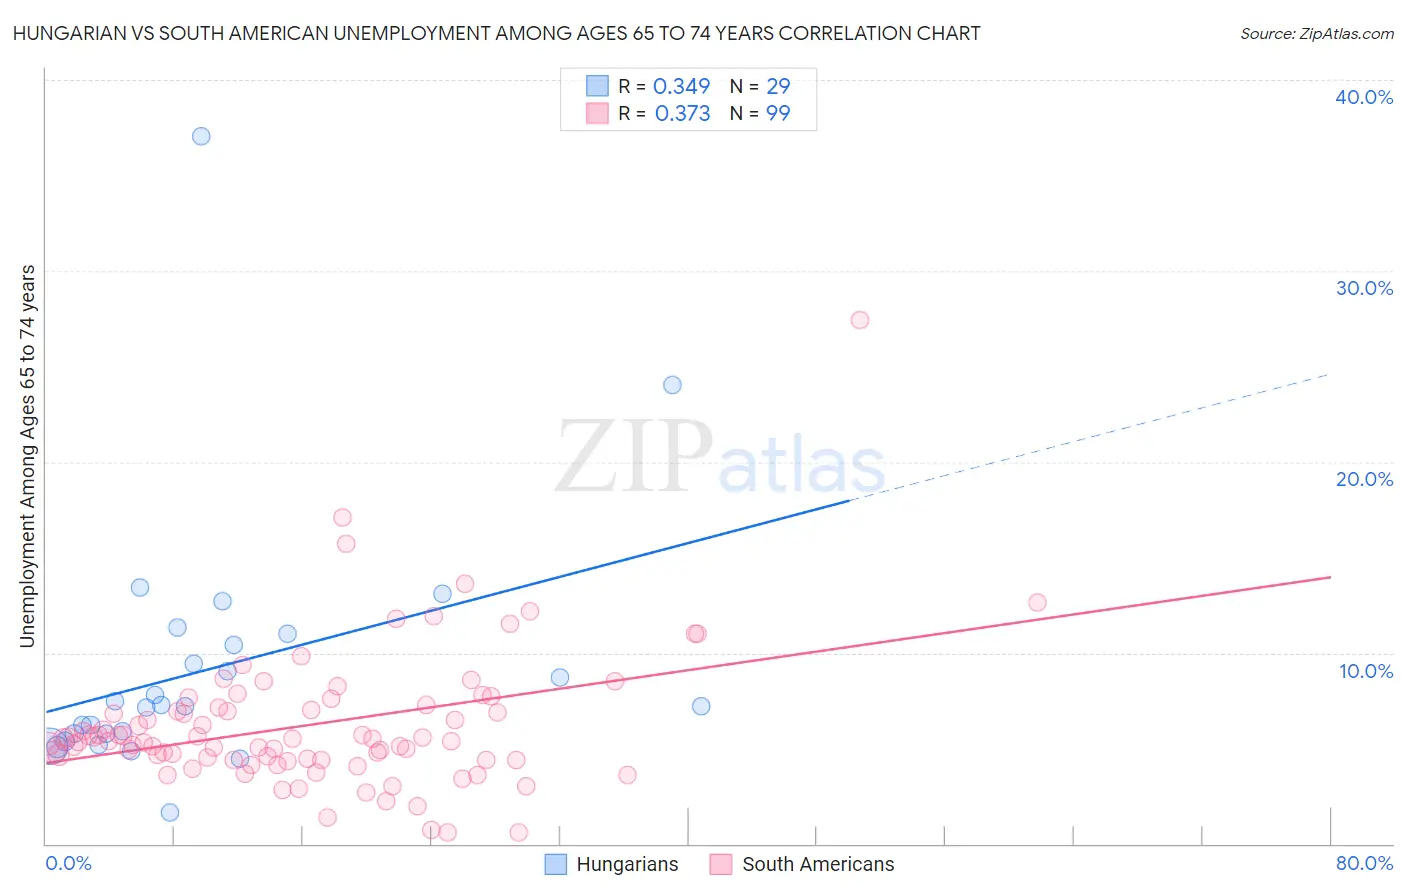
Hungarian vs South American Unemployment Among Ages 65 to 74 years Correlation Chart
The statistical analysis conducted on geographies consisting of 405,744,527 people shows a mild positive correlation between the proportion of Hungarians and unemployment rate among population between the ages 65 and 74 in the United States with a correlation coefficient (R) of 0.349 and weighted average of 5.5%. Similarly, the statistical analysis conducted on geographies consisting of 416,208,579 people shows a mild positive correlation between the proportion of South Americans and unemployment rate among population between the ages 65 and 74 in the United States with a correlation coefficient (R) of 0.373 and weighted average of 5.6%, a difference of 2.5%.
Unemployment Among Ages 65 to 74 years Correlation Summary
| Measurement | Hungarian | South American |
| Minimum | 1.7% | 0.60% |
| Maximum | 37.0% | 27.4% |
| Range | 35.4% | 26.8% |
| Mean | 9.2% | 6.2% |
| Median | 7.2% | 5.4% |
| Interquartile 25% (IQ1) | 5.6% | 4.4% |
| Interquartile 75% (IQ3) | 10.7% | 7.1% |
| Interquartile Range (IQR) | 5.1% | 2.7% |
| Standard Deviation (Sample) | 6.8% | 3.7% |
| Standard Deviation (Population) | 6.7% | 3.6% |
Similar Demographics by Unemployment Among Ages 65 to 74 years
Demographics Similar to Hungarians by Unemployment Among Ages 65 to 74 years
In terms of unemployment among ages 65 to 74 years, the demographic groups most similar to Hungarians are Apache (5.5%, a difference of 0.010%), Immigrants from Uruguay (5.5%, a difference of 0.050%), Spaniard (5.5%, a difference of 0.060%), Immigrants from Trinidad and Tobago (5.5%, a difference of 0.060%), and Immigrants from Syria (5.5%, a difference of 0.11%).
| Demographics | Rating | Rank | Unemployment Among Ages 65 to 74 years |
| Uruguayans | 6.2 /100 | #216 | Tragic 5.5% |
| Blackfeet | 5.8 /100 | #217 | Tragic 5.5% |
| Samoans | 5.7 /100 | #218 | Tragic 5.5% |
| Alsatians | 5.6 /100 | #219 | Tragic 5.5% |
| Immigrants | Syria | 5.1 /100 | #220 | Tragic 5.5% |
| Spaniards | 4.8 /100 | #221 | Tragic 5.5% |
| Apache | 4.5 /100 | #222 | Tragic 5.5% |
| Hungarians | 4.4 /100 | #223 | Tragic 5.5% |
| Immigrants | Uruguay | 4.2 /100 | #224 | Tragic 5.5% |
| Immigrants | Trinidad and Tobago | 4.1 /100 | #225 | Tragic 5.5% |
| Hondurans | 3.7 /100 | #226 | Tragic 5.5% |
| Immigrants | Albania | 3.7 /100 | #227 | Tragic 5.5% |
| Immigrants | Israel | 3.0 /100 | #228 | Tragic 5.5% |
| West Indians | 2.7 /100 | #229 | Tragic 5.5% |
| Immigrants | Caribbean | 2.7 /100 | #230 | Tragic 5.5% |
Demographics Similar to South Americans by Unemployment Among Ages 65 to 74 years
In terms of unemployment among ages 65 to 74 years, the demographic groups most similar to South Americans are Immigrants from Barbados (5.6%, a difference of 0.050%), Immigrants from St. Vincent and the Grenadines (5.6%, a difference of 0.050%), Immigrants from Jamaica (5.6%, a difference of 0.060%), Sierra Leonean (5.6%, a difference of 0.070%), and Pueblo (5.6%, a difference of 0.070%).
| Demographics | Rating | Rank | Unemployment Among Ages 65 to 74 years |
| Immigrants | Costa Rica | 0.5 /100 | #254 | Tragic 5.6% |
| Immigrants | Haiti | 0.4 /100 | #255 | Tragic 5.6% |
| Native Hawaiians | 0.4 /100 | #256 | Tragic 5.6% |
| Immigrants | Southern Europe | 0.3 /100 | #257 | Tragic 5.6% |
| Immigrants | Western Africa | 0.3 /100 | #258 | Tragic 5.6% |
| Sierra Leoneans | 0.2 /100 | #259 | Tragic 5.6% |
| Immigrants | Barbados | 0.2 /100 | #260 | Tragic 5.6% |
| South Americans | 0.2 /100 | #261 | Tragic 5.6% |
| Immigrants | St. Vincent and the Grenadines | 0.2 /100 | #262 | Tragic 5.6% |
| Immigrants | Jamaica | 0.2 /100 | #263 | Tragic 5.6% |
| Pueblo | 0.2 /100 | #264 | Tragic 5.6% |
| Jamaicans | 0.2 /100 | #265 | Tragic 5.6% |
| French Canadians | 0.2 /100 | #266 | Tragic 5.6% |
| Guyanese | 0.2 /100 | #267 | Tragic 5.6% |
| Hawaiians | 0.2 /100 | #268 | Tragic 5.7% |