Slovene vs Okinawan Disability Age 35 to 64
COMPARE
Slovene
Okinawan
Disability Age 35 to 64
Disability Age 35 to 64 Comparison
Slovenes
Okinawans
11.4%
DISABILITY AGE 35 TO 64
36.6/ 100
METRIC RATING
186th/ 347
METRIC RANK
9.4%
DISABILITY AGE 35 TO 64
100.0/ 100
METRIC RATING
21st/ 347
METRIC RANK
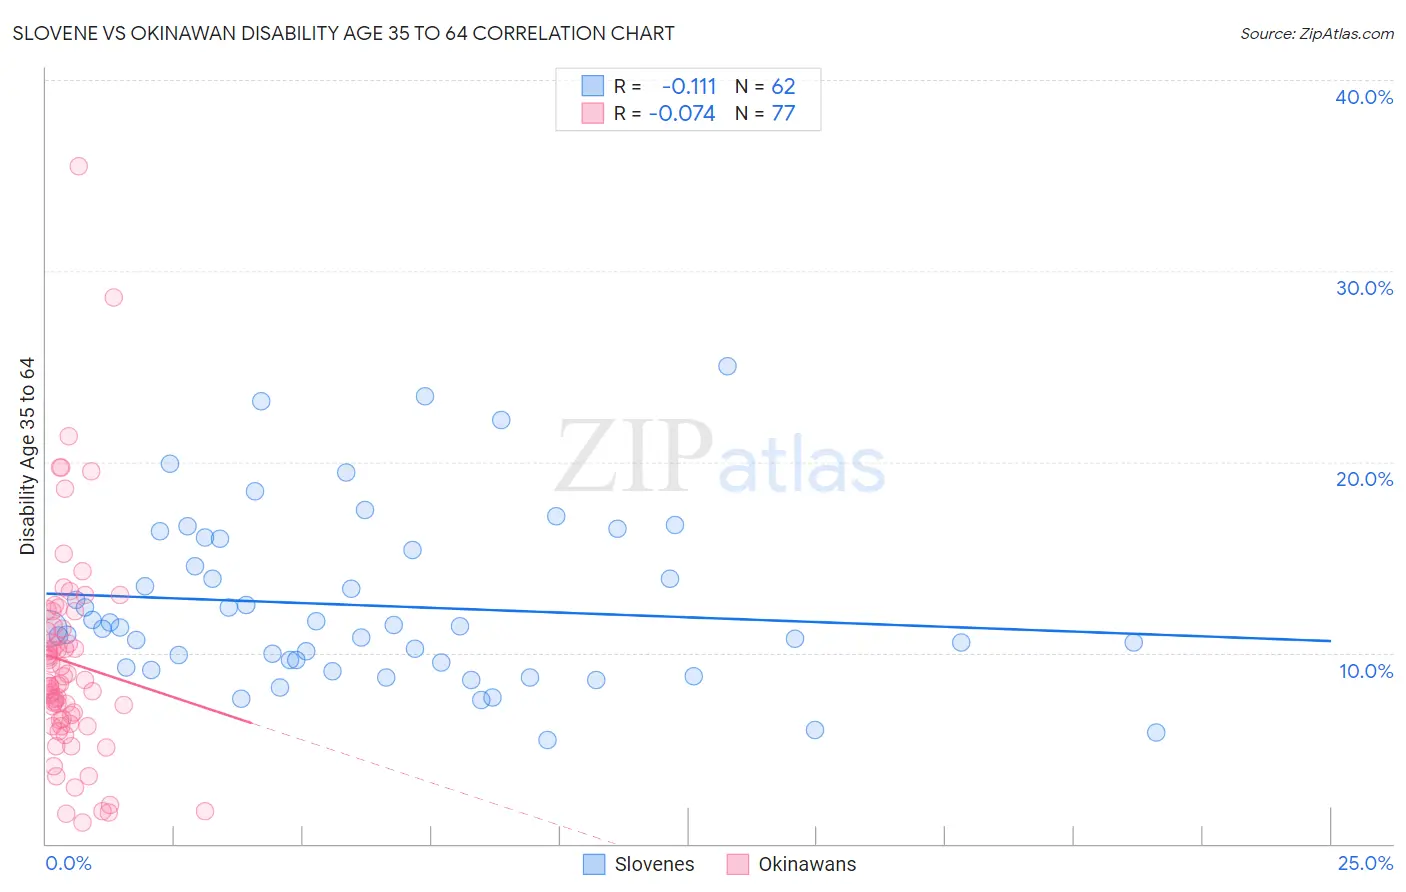
Slovene vs Okinawan Disability Age 35 to 64 Correlation Chart
The statistical analysis conducted on geographies consisting of 261,217,453 people shows a poor negative correlation between the proportion of Slovenes and percentage of population with a disability between the ages 34 and 64 in the United States with a correlation coefficient (R) of -0.111 and weighted average of 11.4%. Similarly, the statistical analysis conducted on geographies consisting of 73,717,976 people shows a slight negative correlation between the proportion of Okinawans and percentage of population with a disability between the ages 34 and 64 in the United States with a correlation coefficient (R) of -0.074 and weighted average of 9.4%, a difference of 21.7%.
Disability Age 35 to 64 Correlation Summary
| Measurement | Slovene | Okinawan |
| Minimum | 5.4% | 1.1% |
| Maximum | 25.0% | 35.5% |
| Range | 19.6% | 34.4% |
| Mean | 12.5% | 9.5% |
| Median | 11.3% | 8.4% |
| Interquartile 25% (IQ1) | 9.5% | 6.4% |
| Interquartile 75% (IQ3) | 15.4% | 11.3% |
| Interquartile Range (IQR) | 5.8% | 4.9% |
| Standard Deviation (Sample) | 4.4% | 5.7% |
| Standard Deviation (Population) | 4.4% | 5.7% |
Similar Demographics by Disability Age 35 to 64
Demographics Similar to Slovenes by Disability Age 35 to 64
In terms of disability age 35 to 64, the demographic groups most similar to Slovenes are Danish (11.4%, a difference of 0.010%), Immigrants from Bosnia and Herzegovina (11.4%, a difference of 0.13%), Northern European (11.4%, a difference of 0.15%), Hungarian (11.4%, a difference of 0.17%), and Kenyan (11.4%, a difference of 0.22%).
| Demographics | Rating | Rank | Disability Age 35 to 64 |
| Immigrants | Barbados | 41.6 /100 | #179 | Average 11.3% |
| Immigrants | Caribbean | 41.5 /100 | #180 | Average 11.3% |
| Trinidadians and Tobagonians | 40.8 /100 | #181 | Average 11.4% |
| Icelanders | 39.7 /100 | #182 | Fair 11.4% |
| Immigrants | Oceania | 39.5 /100 | #183 | Fair 11.4% |
| Kenyans | 39.2 /100 | #184 | Fair 11.4% |
| Danes | 36.8 /100 | #185 | Fair 11.4% |
| Slovenes | 36.6 /100 | #186 | Fair 11.4% |
| Immigrants | Bosnia and Herzegovina | 35.2 /100 | #187 | Fair 11.4% |
| Northern Europeans | 34.9 /100 | #188 | Fair 11.4% |
| Hungarians | 34.6 /100 | #189 | Fair 11.4% |
| Immigrants | Nigeria | 32.5 /100 | #190 | Fair 11.4% |
| Swedes | 31.3 /100 | #191 | Fair 11.4% |
| Norwegians | 29.7 /100 | #192 | Fair 11.5% |
| Immigrants | Africa | 29.0 /100 | #193 | Fair 11.5% |
Demographics Similar to Okinawans by Disability Age 35 to 64
In terms of disability age 35 to 64, the demographic groups most similar to Okinawans are Cypriot (9.4%, a difference of 0.030%), Argentinean (9.4%, a difference of 0.25%), Asian (9.4%, a difference of 0.26%), Immigrants from Argentina (9.3%, a difference of 0.43%), and Venezuelan (9.4%, a difference of 0.56%).
| Demographics | Rating | Rank | Disability Age 35 to 64 |
| Immigrants | Singapore | 100.0 /100 | #14 | Exceptional 8.9% |
| Bolivians | 100.0 /100 | #15 | Exceptional 8.9% |
| Immigrants | Korea | 100.0 /100 | #16 | Exceptional 9.0% |
| Burmese | 100.0 /100 | #17 | Exceptional 9.2% |
| Soviet Union | 100.0 /100 | #18 | Exceptional 9.2% |
| Immigrants | Venezuela | 100.0 /100 | #19 | Exceptional 9.3% |
| Immigrants | Argentina | 100.0 /100 | #20 | Exceptional 9.3% |
| Okinawans | 100.0 /100 | #21 | Exceptional 9.4% |
| Cypriots | 100.0 /100 | #22 | Exceptional 9.4% |
| Argentineans | 100.0 /100 | #23 | Exceptional 9.4% |
| Asians | 100.0 /100 | #24 | Exceptional 9.4% |
| Venezuelans | 100.0 /100 | #25 | Exceptional 9.4% |
| Immigrants | Sri Lanka | 100.0 /100 | #26 | Exceptional 9.5% |
| Immigrants | Asia | 100.0 /100 | #27 | Exceptional 9.5% |
| Immigrants | Pakistan | 100.0 /100 | #28 | Exceptional 9.5% |