Honduran vs Okinawan Disability Age 35 to 64
COMPARE
Honduran
Okinawan
Disability Age 35 to 64
Disability Age 35 to 64 Comparison
Hondurans
Okinawans
11.8%
DISABILITY AGE 35 TO 64
8.4/ 100
METRIC RATING
222nd/ 347
METRIC RANK
9.4%
DISABILITY AGE 35 TO 64
100.0/ 100
METRIC RATING
21st/ 347
METRIC RANK
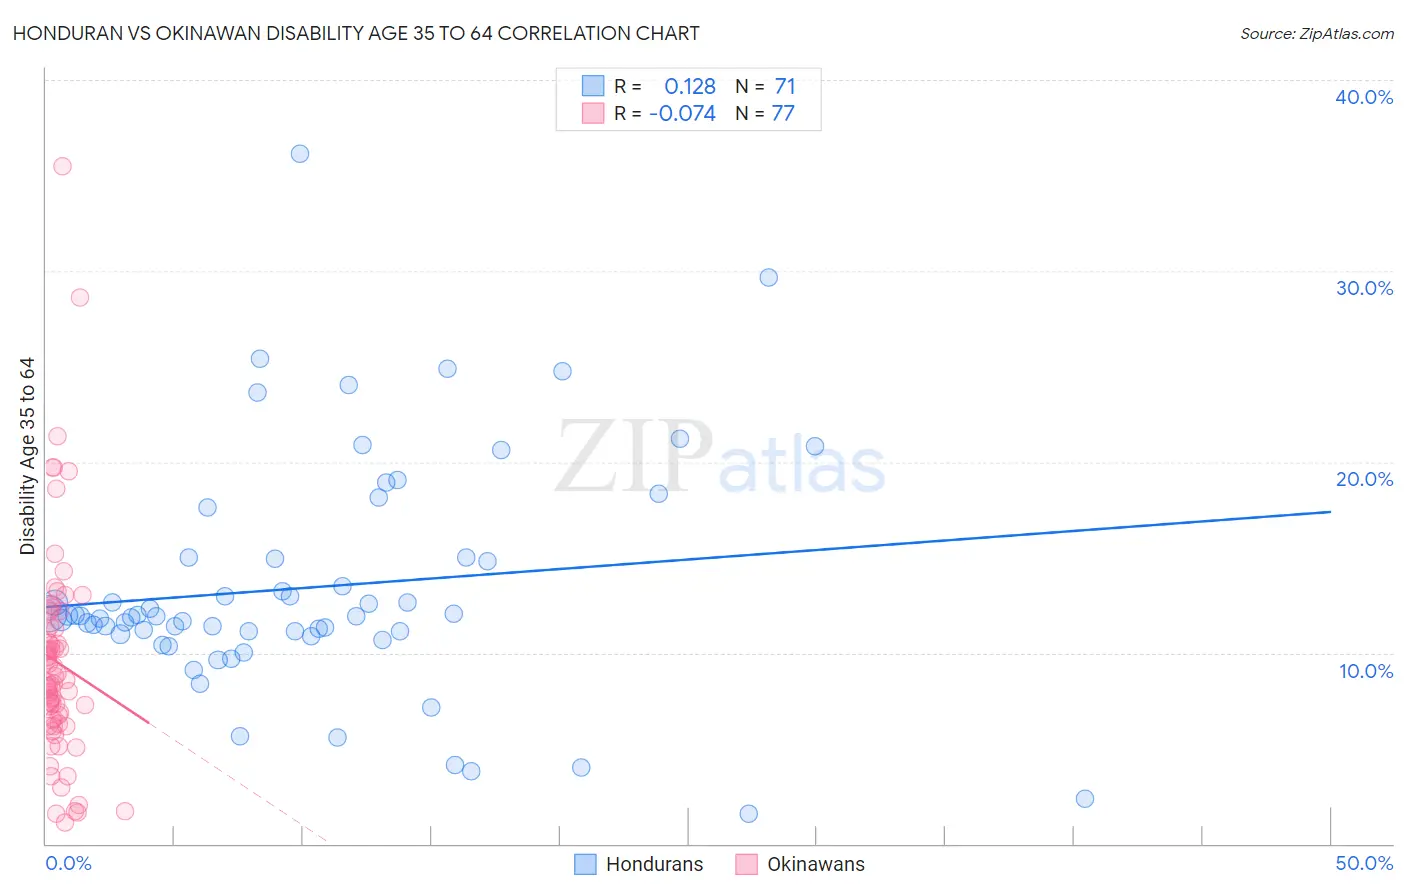
Honduran vs Okinawan Disability Age 35 to 64 Correlation Chart
The statistical analysis conducted on geographies consisting of 357,560,855 people shows a poor positive correlation between the proportion of Hondurans and percentage of population with a disability between the ages 34 and 64 in the United States with a correlation coefficient (R) of 0.128 and weighted average of 11.8%. Similarly, the statistical analysis conducted on geographies consisting of 73,717,976 people shows a slight negative correlation between the proportion of Okinawans and percentage of population with a disability between the ages 34 and 64 in the United States with a correlation coefficient (R) of -0.074 and weighted average of 9.4%, a difference of 26.2%.
Disability Age 35 to 64 Correlation Summary
| Measurement | Honduran | Okinawan |
| Minimum | 1.6% | 1.1% |
| Maximum | 36.1% | 35.5% |
| Range | 34.5% | 34.4% |
| Mean | 13.4% | 9.5% |
| Median | 11.9% | 8.4% |
| Interquartile 25% (IQ1) | 11.0% | 6.4% |
| Interquartile 75% (IQ3) | 15.0% | 11.3% |
| Interquartile Range (IQR) | 4.0% | 4.9% |
| Standard Deviation (Sample) | 6.2% | 5.7% |
| Standard Deviation (Population) | 6.1% | 5.7% |
Similar Demographics by Disability Age 35 to 64
Demographics Similar to Hondurans by Disability Age 35 to 64
In terms of disability age 35 to 64, the demographic groups most similar to Hondurans are Immigrants from Honduras (11.8%, a difference of 0.0%), Alsatian (11.8%, a difference of 0.020%), Immigrants from West Indies (11.8%, a difference of 0.10%), Czechoslovakian (11.8%, a difference of 0.15%), and Immigrants from Ghana (11.8%, a difference of 0.15%).
| Demographics | Rating | Rank | Disability Age 35 to 64 |
| Spanish American Indians | 11.1 /100 | #215 | Poor 11.7% |
| Bahamians | 10.7 /100 | #216 | Poor 11.8% |
| Barbadians | 9.5 /100 | #217 | Tragic 11.8% |
| Immigrants | Bahamas | 9.2 /100 | #218 | Tragic 11.8% |
| Czechoslovakians | 9.0 /100 | #219 | Tragic 11.8% |
| Immigrants | West Indies | 8.9 /100 | #220 | Tragic 11.8% |
| Alsatians | 8.5 /100 | #221 | Tragic 11.8% |
| Hondurans | 8.4 /100 | #222 | Tragic 11.8% |
| Immigrants | Honduras | 8.4 /100 | #223 | Tragic 11.8% |
| Immigrants | Ghana | 7.8 /100 | #224 | Tragic 11.8% |
| Immigrants | Belize | 6.6 /100 | #225 | Tragic 11.9% |
| Scandinavians | 6.4 /100 | #226 | Tragic 11.9% |
| Immigrants | Central America | 6.3 /100 | #227 | Tragic 11.9% |
| Immigrants | Germany | 6.2 /100 | #228 | Tragic 11.9% |
| British West Indians | 6.1 /100 | #229 | Tragic 11.9% |
Demographics Similar to Okinawans by Disability Age 35 to 64
In terms of disability age 35 to 64, the demographic groups most similar to Okinawans are Cypriot (9.4%, a difference of 0.030%), Argentinean (9.4%, a difference of 0.25%), Asian (9.4%, a difference of 0.26%), Immigrants from Argentina (9.3%, a difference of 0.43%), and Venezuelan (9.4%, a difference of 0.56%).
| Demographics | Rating | Rank | Disability Age 35 to 64 |
| Immigrants | Singapore | 100.0 /100 | #14 | Exceptional 8.9% |
| Bolivians | 100.0 /100 | #15 | Exceptional 8.9% |
| Immigrants | Korea | 100.0 /100 | #16 | Exceptional 9.0% |
| Burmese | 100.0 /100 | #17 | Exceptional 9.2% |
| Soviet Union | 100.0 /100 | #18 | Exceptional 9.2% |
| Immigrants | Venezuela | 100.0 /100 | #19 | Exceptional 9.3% |
| Immigrants | Argentina | 100.0 /100 | #20 | Exceptional 9.3% |
| Okinawans | 100.0 /100 | #21 | Exceptional 9.4% |
| Cypriots | 100.0 /100 | #22 | Exceptional 9.4% |
| Argentineans | 100.0 /100 | #23 | Exceptional 9.4% |
| Asians | 100.0 /100 | #24 | Exceptional 9.4% |
| Venezuelans | 100.0 /100 | #25 | Exceptional 9.4% |
| Immigrants | Sri Lanka | 100.0 /100 | #26 | Exceptional 9.5% |
| Immigrants | Asia | 100.0 /100 | #27 | Exceptional 9.5% |
| Immigrants | Pakistan | 100.0 /100 | #28 | Exceptional 9.5% |