Houma vs Indonesian Single Father Households
COMPARE
Houma
Indonesian
Single Father Households
Single Father Households Comparison
Houma
Indonesians
2.9%
SINGLE FATHER HOUSEHOLDS
0.0/ 100
METRIC RATING
316th/ 347
METRIC RANK
2.6%
SINGLE FATHER HOUSEHOLDS
0.5/ 100
METRIC RATING
264th/ 347
METRIC RANK
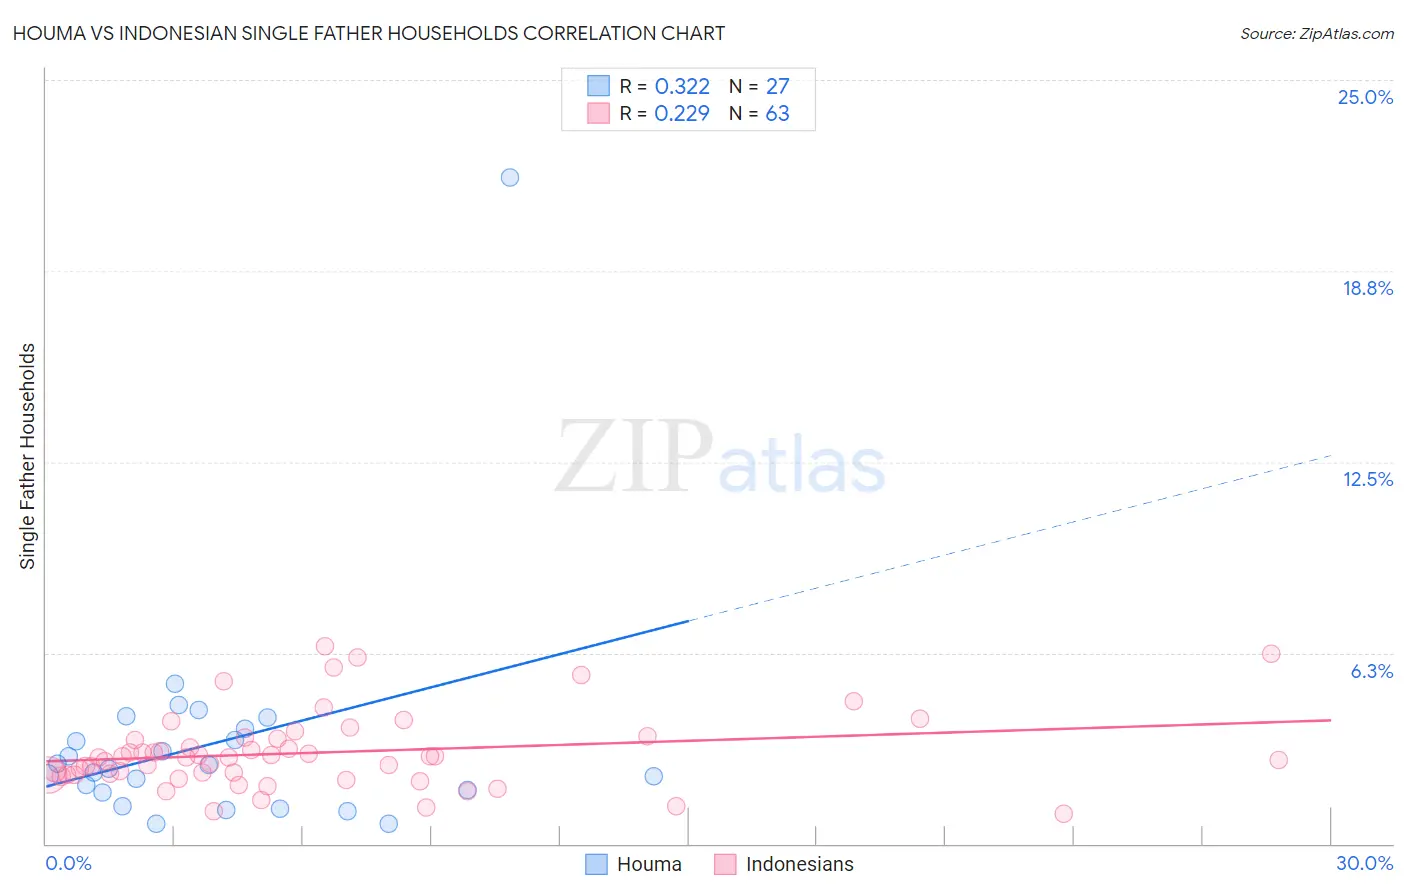
Houma vs Indonesian Single Father Households Correlation Chart
The statistical analysis conducted on geographies consisting of 36,727,905 people shows a mild positive correlation between the proportion of Houma and percentage of single father households in the United States with a correlation coefficient (R) of 0.322 and weighted average of 2.9%. Similarly, the statistical analysis conducted on geographies consisting of 162,222,781 people shows a weak positive correlation between the proportion of Indonesians and percentage of single father households in the United States with a correlation coefficient (R) of 0.229 and weighted average of 2.6%, a difference of 13.9%.
Single Father Households Correlation Summary
| Measurement | Houma | Indonesian |
| Minimum | 0.65% | 0.98% |
| Maximum | 21.8% | 6.5% |
| Range | 21.2% | 5.5% |
| Mean | 3.3% | 3.0% |
| Median | 2.5% | 2.8% |
| Interquartile 25% (IQ1) | 1.7% | 2.3% |
| Interquartile 75% (IQ3) | 3.8% | 3.4% |
| Interquartile Range (IQR) | 2.1% | 1.2% |
| Standard Deviation (Sample) | 3.9% | 1.2% |
| Standard Deviation (Population) | 3.8% | 1.2% |
Similar Demographics by Single Father Households
Demographics Similar to Houma by Single Father Households
In terms of single father households, the demographic groups most similar to Houma are Cheyenne (2.9%, a difference of 0.0%), Salvadoran (2.9%, a difference of 0.39%), Arapaho (2.9%, a difference of 0.64%), Immigrants from El Salvador (2.9%, a difference of 0.86%), and Cape Verdean (2.9%, a difference of 0.87%).
| Demographics | Rating | Rank | Single Father Households |
| Central Americans | 0.0 /100 | #309 | Tragic 2.9% |
| Immigrants | Laos | 0.0 /100 | #310 | Tragic 2.9% |
| Spanish American Indians | 0.0 /100 | #311 | Tragic 2.9% |
| Tsimshian | 0.0 /100 | #312 | Tragic 2.9% |
| Arapaho | 0.0 /100 | #313 | Tragic 2.9% |
| Salvadorans | 0.0 /100 | #314 | Tragic 2.9% |
| Cheyenne | 0.0 /100 | #315 | Tragic 2.9% |
| Houma | 0.0 /100 | #316 | Tragic 2.9% |
| Immigrants | El Salvador | 0.0 /100 | #317 | Tragic 2.9% |
| Cape Verdeans | 0.0 /100 | #318 | Tragic 2.9% |
| Ute | 0.0 /100 | #319 | Tragic 3.0% |
| Guatemalans | 0.0 /100 | #320 | Tragic 3.0% |
| Mexicans | 0.0 /100 | #321 | Tragic 3.0% |
| Immigrants | Guatemala | 0.0 /100 | #322 | Tragic 3.0% |
| Immigrants | Central America | 0.0 /100 | #323 | Tragic 3.0% |
Demographics Similar to Indonesians by Single Father Households
In terms of single father households, the demographic groups most similar to Indonesians are Immigrants from Micronesia (2.6%, a difference of 0.060%), French American Indian (2.6%, a difference of 0.10%), Guamanian/Chamorro (2.6%, a difference of 0.57%), Haitian (2.6%, a difference of 0.61%), and Dominican (2.5%, a difference of 0.69%).
| Demographics | Rating | Rank | Single Father Households |
| Immigrants | Congo | 1.2 /100 | #257 | Tragic 2.5% |
| Spanish | 1.1 /100 | #258 | Tragic 2.5% |
| Comanche | 1.0 /100 | #259 | Tragic 2.5% |
| Immigrants | Caribbean | 1.0 /100 | #260 | Tragic 2.5% |
| Immigrants | Belize | 0.9 /100 | #261 | Tragic 2.5% |
| Immigrants | Liberia | 0.8 /100 | #262 | Tragic 2.5% |
| Dominicans | 0.8 /100 | #263 | Tragic 2.5% |
| Indonesians | 0.5 /100 | #264 | Tragic 2.6% |
| Immigrants | Micronesia | 0.5 /100 | #265 | Tragic 2.6% |
| French American Indians | 0.5 /100 | #266 | Tragic 2.6% |
| Guamanians/Chamorros | 0.4 /100 | #267 | Tragic 2.6% |
| Haitians | 0.4 /100 | #268 | Tragic 2.6% |
| Cubans | 0.3 /100 | #269 | Tragic 2.6% |
| Seminole | 0.3 /100 | #270 | Tragic 2.6% |
| Creek | 0.2 /100 | #271 | Tragic 2.6% |