Immigrants from Argentina vs Burmese Hearing Disability
COMPARE
Immigrants from Argentina
Burmese
Hearing Disability
Hearing Disability Comparison
Immigrants from Argentina
Burmese
2.8%
HEARING DISABILITY
97.0/ 100
METRIC RATING
84th/ 347
METRIC RANK
2.8%
HEARING DISABILITY
94.2/ 100
METRIC RATING
104th/ 347
METRIC RANK
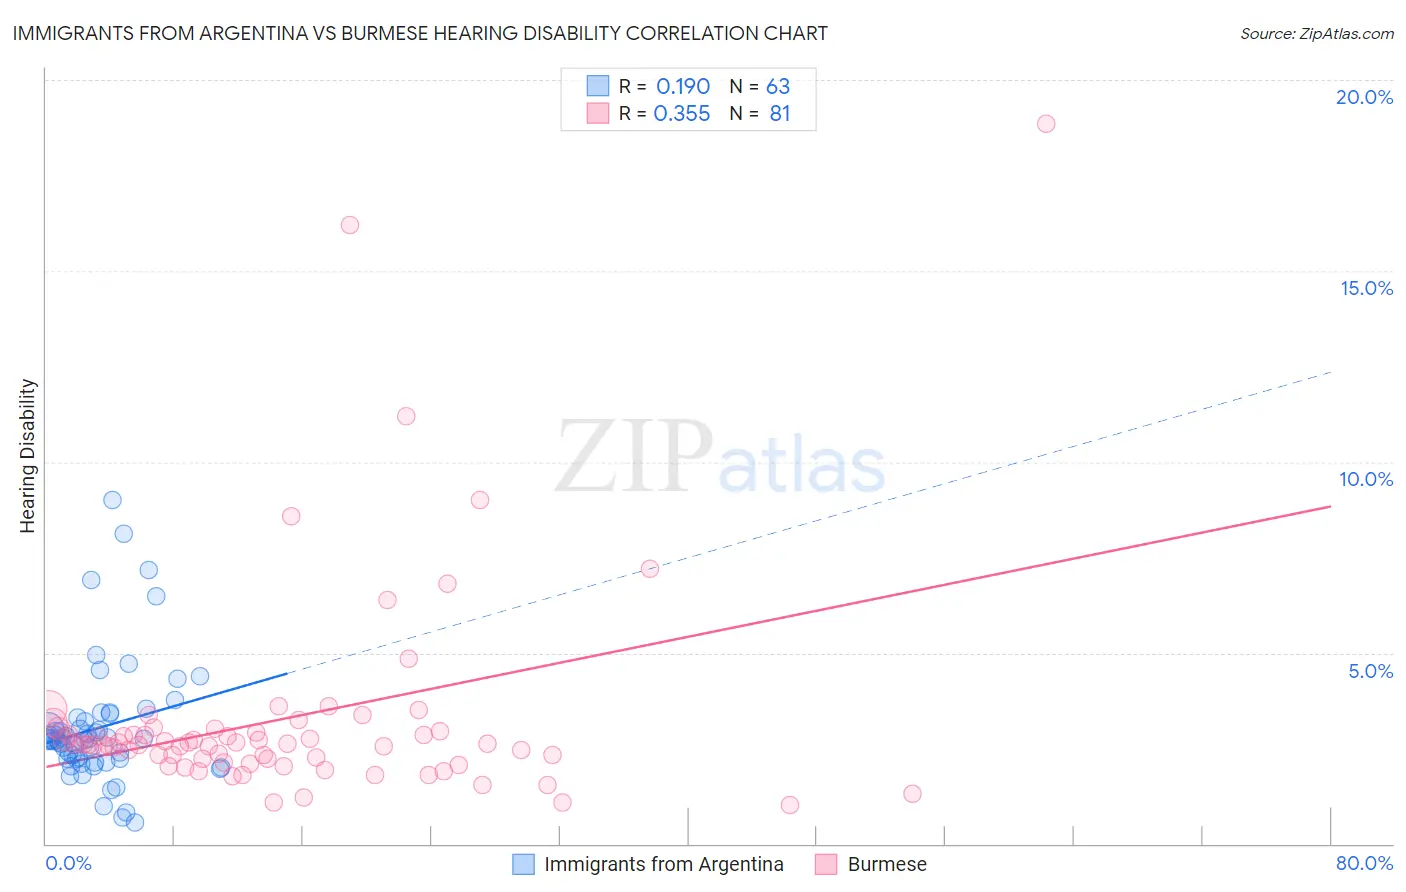
Immigrants from Argentina vs Burmese Hearing Disability Correlation Chart
The statistical analysis conducted on geographies consisting of 264,393,867 people shows a poor positive correlation between the proportion of Immigrants from Argentina and percentage of population with hearing disability in the United States with a correlation coefficient (R) of 0.190 and weighted average of 2.8%. Similarly, the statistical analysis conducted on geographies consisting of 465,070,150 people shows a mild positive correlation between the proportion of Burmese and percentage of population with hearing disability in the United States with a correlation coefficient (R) of 0.355 and weighted average of 2.8%, a difference of 1.7%.
Hearing Disability Correlation Summary
| Measurement | Immigrants from Argentina | Burmese |
| Minimum | 0.57% | 1.0% |
| Maximum | 9.0% | 18.9% |
| Range | 8.4% | 17.8% |
| Mean | 3.0% | 3.3% |
| Median | 2.7% | 2.6% |
| Interquartile 25% (IQ1) | 2.2% | 2.2% |
| Interquartile 75% (IQ3) | 3.3% | 3.0% |
| Interquartile Range (IQR) | 1.1% | 0.80% |
| Standard Deviation (Sample) | 1.6% | 2.8% |
| Standard Deviation (Population) | 1.6% | 2.8% |
Demographics Similar to Immigrants from Argentina and Burmese by Hearing Disability
In terms of hearing disability, the demographic groups most similar to Immigrants from Argentina are Immigrants from Northern Africa (2.8%, a difference of 0.070%), Immigrants from Iran (2.8%, a difference of 0.10%), Somali (2.8%, a difference of 0.21%), Immigrants from Turkey (2.8%, a difference of 0.24%), and Belizean (2.8%, a difference of 0.27%). Similarly, the demographic groups most similar to Burmese are Immigrants from Indonesia (2.8%, a difference of 0.27%), Taiwanese (2.8%, a difference of 0.32%), Immigrants from Spain (2.8%, a difference of 0.33%), Immigrants from Eastern Africa (2.8%, a difference of 0.39%), and Immigrants from Guatemala (2.8%, a difference of 0.44%).
| Demographics | Rating | Rank | Hearing Disability |
| Immigrants | Argentina | 97.0 /100 | #84 | Exceptional 2.8% |
| Immigrants | Northern Africa | 96.9 /100 | #85 | Exceptional 2.8% |
| Immigrants | Iran | 96.8 /100 | #86 | Exceptional 2.8% |
| Somalis | 96.7 /100 | #87 | Exceptional 2.8% |
| Immigrants | Turkey | 96.7 /100 | #88 | Exceptional 2.8% |
| Belizeans | 96.6 /100 | #89 | Exceptional 2.8% |
| Immigrants | Morocco | 96.6 /100 | #90 | Exceptional 2.8% |
| Immigrants | Middle Africa | 96.5 /100 | #91 | Exceptional 2.8% |
| Iranians | 96.4 /100 | #92 | Exceptional 2.8% |
| Immigrants | Kuwait | 96.3 /100 | #93 | Exceptional 2.8% |
| Uruguayans | 95.9 /100 | #94 | Exceptional 2.8% |
| Israelis | 95.9 /100 | #95 | Exceptional 2.8% |
| Immigrants | Somalia | 95.5 /100 | #96 | Exceptional 2.8% |
| Immigrants | Afghanistan | 95.3 /100 | #97 | Exceptional 2.8% |
| Immigrants | Honduras | 95.1 /100 | #98 | Exceptional 2.8% |
| Immigrants | Guatemala | 95.1 /100 | #99 | Exceptional 2.8% |
| Immigrants | Eastern Africa | 95.0 /100 | #100 | Exceptional 2.8% |
| Immigrants | Spain | 94.9 /100 | #101 | Exceptional 2.8% |
| Taiwanese | 94.8 /100 | #102 | Exceptional 2.8% |
| Immigrants | Indonesia | 94.7 /100 | #103 | Exceptional 2.8% |
| Burmese | 94.2 /100 | #104 | Exceptional 2.8% |