Immigrants from Sri Lanka vs Burmese Hearing Disability
COMPARE
Immigrants from Sri Lanka
Burmese
Hearing Disability
Hearing Disability Comparison
Immigrants from Sri Lanka
Burmese
2.7%
HEARING DISABILITY
98.4/ 100
METRIC RATING
64th/ 347
METRIC RANK
2.8%
HEARING DISABILITY
94.2/ 100
METRIC RATING
104th/ 347
METRIC RANK
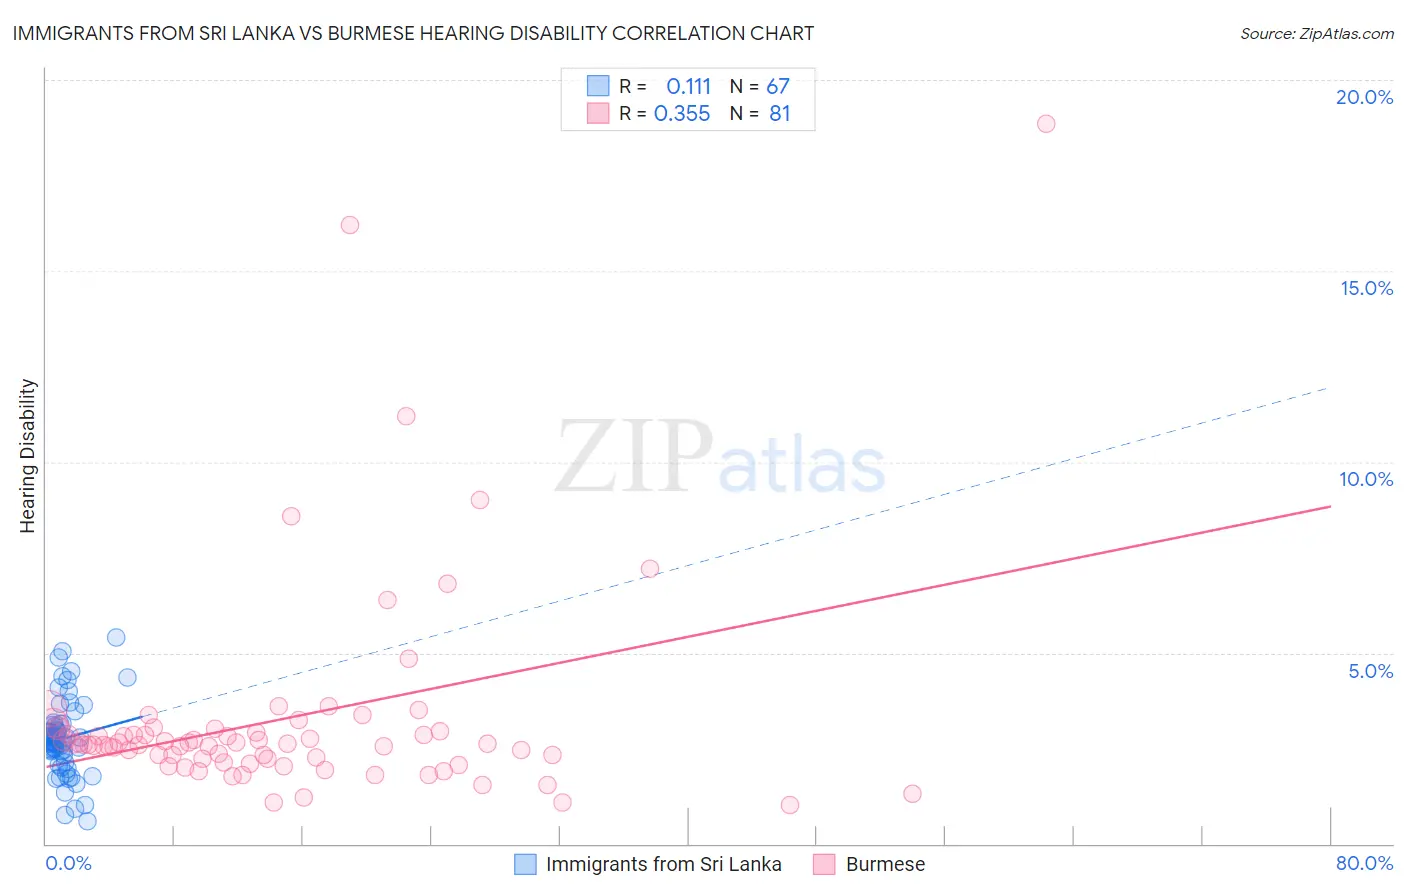
Immigrants from Sri Lanka vs Burmese Hearing Disability Correlation Chart
The statistical analysis conducted on geographies consisting of 149,683,223 people shows a poor positive correlation between the proportion of Immigrants from Sri Lanka and percentage of population with hearing disability in the United States with a correlation coefficient (R) of 0.111 and weighted average of 2.7%. Similarly, the statistical analysis conducted on geographies consisting of 465,070,150 people shows a mild positive correlation between the proportion of Burmese and percentage of population with hearing disability in the United States with a correlation coefficient (R) of 0.355 and weighted average of 2.8%, a difference of 3.4%.
Hearing Disability Correlation Summary
| Measurement | Immigrants from Sri Lanka | Burmese |
| Minimum | 0.58% | 1.0% |
| Maximum | 5.4% | 18.9% |
| Range | 4.8% | 17.8% |
| Mean | 2.8% | 3.3% |
| Median | 2.7% | 2.6% |
| Interquartile 25% (IQ1) | 2.3% | 2.2% |
| Interquartile 75% (IQ3) | 3.1% | 3.0% |
| Interquartile Range (IQR) | 0.80% | 0.80% |
| Standard Deviation (Sample) | 0.97% | 2.8% |
| Standard Deviation (Population) | 0.97% | 2.8% |
Similar Demographics by Hearing Disability
Demographics Similar to Immigrants from Sri Lanka by Hearing Disability
In terms of hearing disability, the demographic groups most similar to Immigrants from Sri Lanka are Indian (Asian) (2.7%, a difference of 0.050%), Immigrants from Nepal (2.7%, a difference of 0.080%), Immigrants from Uzbekistan (2.7%, a difference of 0.11%), Immigrants from Colombia (2.7%, a difference of 0.11%), and Immigrants from Belize (2.7%, a difference of 0.21%).
| Demographics | Rating | Rank | Hearing Disability |
| South Americans | 99.0 /100 | #57 | Exceptional 2.7% |
| Immigrants | Peru | 98.6 /100 | #58 | Exceptional 2.7% |
| Immigrants | Eritrea | 98.5 /100 | #59 | Exceptional 2.7% |
| Immigrants | Egypt | 98.5 /100 | #60 | Exceptional 2.7% |
| Immigrants | Uzbekistan | 98.4 /100 | #61 | Exceptional 2.7% |
| Immigrants | Colombia | 98.4 /100 | #62 | Exceptional 2.7% |
| Indians (Asian) | 98.4 /100 | #63 | Exceptional 2.7% |
| Immigrants | Sri Lanka | 98.4 /100 | #64 | Exceptional 2.7% |
| Immigrants | Nepal | 98.3 /100 | #65 | Exceptional 2.7% |
| Immigrants | Belize | 98.2 /100 | #66 | Exceptional 2.7% |
| Egyptians | 98.1 /100 | #67 | Exceptional 2.7% |
| Immigrants | Africa | 98.0 /100 | #68 | Exceptional 2.7% |
| Nicaraguans | 97.9 /100 | #69 | Exceptional 2.7% |
| Peruvians | 97.7 /100 | #70 | Exceptional 2.7% |
| Central Americans | 97.7 /100 | #71 | Exceptional 2.7% |
Demographics Similar to Burmese by Hearing Disability
In terms of hearing disability, the demographic groups most similar to Burmese are Moroccan (2.8%, a difference of 0.11%), Immigrants from Indonesia (2.8%, a difference of 0.27%), Taiwanese (2.8%, a difference of 0.32%), Immigrants from Spain (2.8%, a difference of 0.33%), and Honduran (2.8%, a difference of 0.35%).
| Demographics | Rating | Rank | Hearing Disability |
| Immigrants | Afghanistan | 95.3 /100 | #97 | Exceptional 2.8% |
| Immigrants | Honduras | 95.1 /100 | #98 | Exceptional 2.8% |
| Immigrants | Guatemala | 95.1 /100 | #99 | Exceptional 2.8% |
| Immigrants | Eastern Africa | 95.0 /100 | #100 | Exceptional 2.8% |
| Immigrants | Spain | 94.9 /100 | #101 | Exceptional 2.8% |
| Taiwanese | 94.8 /100 | #102 | Exceptional 2.8% |
| Immigrants | Indonesia | 94.7 /100 | #103 | Exceptional 2.8% |
| Burmese | 94.2 /100 | #104 | Exceptional 2.8% |
| Moroccans | 93.9 /100 | #105 | Exceptional 2.8% |
| Hondurans | 93.4 /100 | #106 | Exceptional 2.8% |
| Immigrants | Chile | 93.4 /100 | #107 | Exceptional 2.8% |
| Guatemalans | 93.2 /100 | #108 | Exceptional 2.8% |
| Turks | 93.0 /100 | #109 | Exceptional 2.8% |
| Cypriots | 92.9 /100 | #110 | Exceptional 2.8% |
| Immigrants | Yemen | 92.7 /100 | #111 | Exceptional 2.8% |