Honduran vs Immigrants from Egypt Cognitive Disability
COMPARE
Honduran
Immigrants from Egypt
Cognitive Disability
Cognitive Disability Comparison
Hondurans
Immigrants from Egypt
18.0%
COGNITIVE DISABILITY
0.3/ 100
METRIC RATING
269th/ 347
METRIC RANK
16.7%
COGNITIVE DISABILITY
98.8/ 100
METRIC RATING
89th/ 347
METRIC RANK
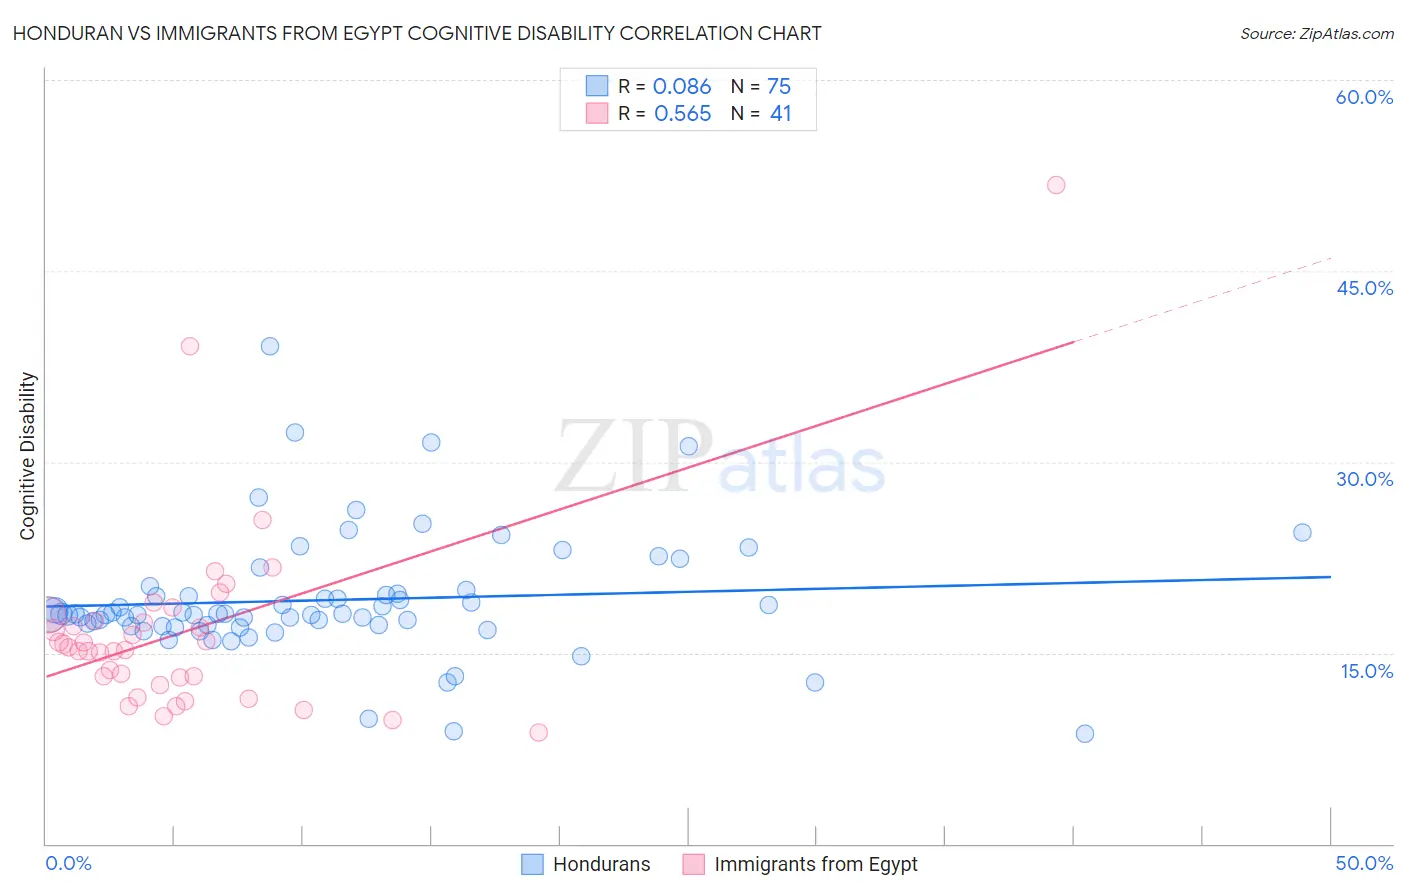
Honduran vs Immigrants from Egypt Cognitive Disability Correlation Chart
The statistical analysis conducted on geographies consisting of 357,766,918 people shows a slight positive correlation between the proportion of Hondurans and percentage of population with cognitive disability in the United States with a correlation coefficient (R) of 0.086 and weighted average of 18.0%. Similarly, the statistical analysis conducted on geographies consisting of 245,492,829 people shows a substantial positive correlation between the proportion of Immigrants from Egypt and percentage of population with cognitive disability in the United States with a correlation coefficient (R) of 0.565 and weighted average of 16.7%, a difference of 7.6%.
Cognitive Disability Correlation Summary
| Measurement | Honduran | Immigrants from Egypt |
| Minimum | 8.7% | 8.8% |
| Maximum | 39.1% | 51.8% |
| Range | 30.5% | 43.0% |
| Mean | 19.1% | 16.7% |
| Median | 18.0% | 15.4% |
| Interquartile 25% (IQ1) | 17.1% | 12.8% |
| Interquartile 75% (IQ3) | 19.6% | 17.7% |
| Interquartile Range (IQR) | 2.5% | 5.0% |
| Standard Deviation (Sample) | 4.9% | 7.6% |
| Standard Deviation (Population) | 4.8% | 7.5% |
Similar Demographics by Cognitive Disability
Demographics Similar to Hondurans by Cognitive Disability
In terms of cognitive disability, the demographic groups most similar to Hondurans are Immigrants from Bahamas (18.0%, a difference of 0.010%), Potawatomi (18.0%, a difference of 0.080%), Immigrants from Honduras (18.0%, a difference of 0.10%), Cherokee (18.0%, a difference of 0.14%), and Nepalese (18.0%, a difference of 0.15%).
| Demographics | Rating | Rank | Cognitive Disability |
| Sierra Leoneans | 0.4 /100 | #262 | Tragic 17.9% |
| Immigrants | Barbados | 0.4 /100 | #263 | Tragic 17.9% |
| Menominee | 0.4 /100 | #264 | Tragic 18.0% |
| Spanish Americans | 0.4 /100 | #265 | Tragic 18.0% |
| Belizeans | 0.4 /100 | #266 | Tragic 18.0% |
| Nepalese | 0.3 /100 | #267 | Tragic 18.0% |
| Cherokee | 0.3 /100 | #268 | Tragic 18.0% |
| Hondurans | 0.3 /100 | #269 | Tragic 18.0% |
| Immigrants | Bahamas | 0.3 /100 | #270 | Tragic 18.0% |
| Potawatomi | 0.2 /100 | #271 | Tragic 18.0% |
| Immigrants | Honduras | 0.2 /100 | #272 | Tragic 18.0% |
| Immigrants | Nepal | 0.2 /100 | #273 | Tragic 18.0% |
| Immigrants | Nigeria | 0.2 /100 | #274 | Tragic 18.0% |
| Immigrants | Laos | 0.2 /100 | #275 | Tragic 18.1% |
| Yuman | 0.2 /100 | #276 | Tragic 18.1% |
Demographics Similar to Immigrants from Egypt by Cognitive Disability
In terms of cognitive disability, the demographic groups most similar to Immigrants from Egypt are South American (16.7%, a difference of 0.0%), Danish (16.7%, a difference of 0.010%), Immigrants from South America (16.7%, a difference of 0.020%), Immigrants from Southern Europe (16.7%, a difference of 0.020%), and Asian (16.7%, a difference of 0.070%).
| Demographics | Rating | Rank | Cognitive Disability |
| Swiss | 99.2 /100 | #82 | Exceptional 16.7% |
| Serbians | 99.1 /100 | #83 | Exceptional 16.7% |
| Belgians | 99.1 /100 | #84 | Exceptional 16.7% |
| Immigrants | Moldova | 99.1 /100 | #85 | Exceptional 16.7% |
| Immigrants | South Africa | 99.0 /100 | #86 | Exceptional 16.7% |
| Native Hawaiians | 99.0 /100 | #87 | Exceptional 16.7% |
| Immigrants | Philippines | 99.0 /100 | #88 | Exceptional 16.7% |
| Immigrants | Egypt | 98.8 /100 | #89 | Exceptional 16.7% |
| South Americans | 98.8 /100 | #90 | Exceptional 16.7% |
| Danes | 98.8 /100 | #91 | Exceptional 16.7% |
| Immigrants | South America | 98.8 /100 | #92 | Exceptional 16.7% |
| Immigrants | Southern Europe | 98.7 /100 | #93 | Exceptional 16.7% |
| Asians | 98.7 /100 | #94 | Exceptional 16.7% |
| English | 98.6 /100 | #95 | Exceptional 16.8% |
| Finns | 98.5 /100 | #96 | Exceptional 16.8% |