Hawaiian vs Kiowa Cognitive Disability
COMPARE
Hawaiian
Kiowa
Cognitive Disability
Cognitive Disability Comparison
Hawaiians
Kiowa
17.6%
COGNITIVE DISABILITY
7.2/ 100
METRIC RATING
213th/ 347
METRIC RANK
18.7%
COGNITIVE DISABILITY
0.0/ 100
METRIC RATING
328th/ 347
METRIC RANK
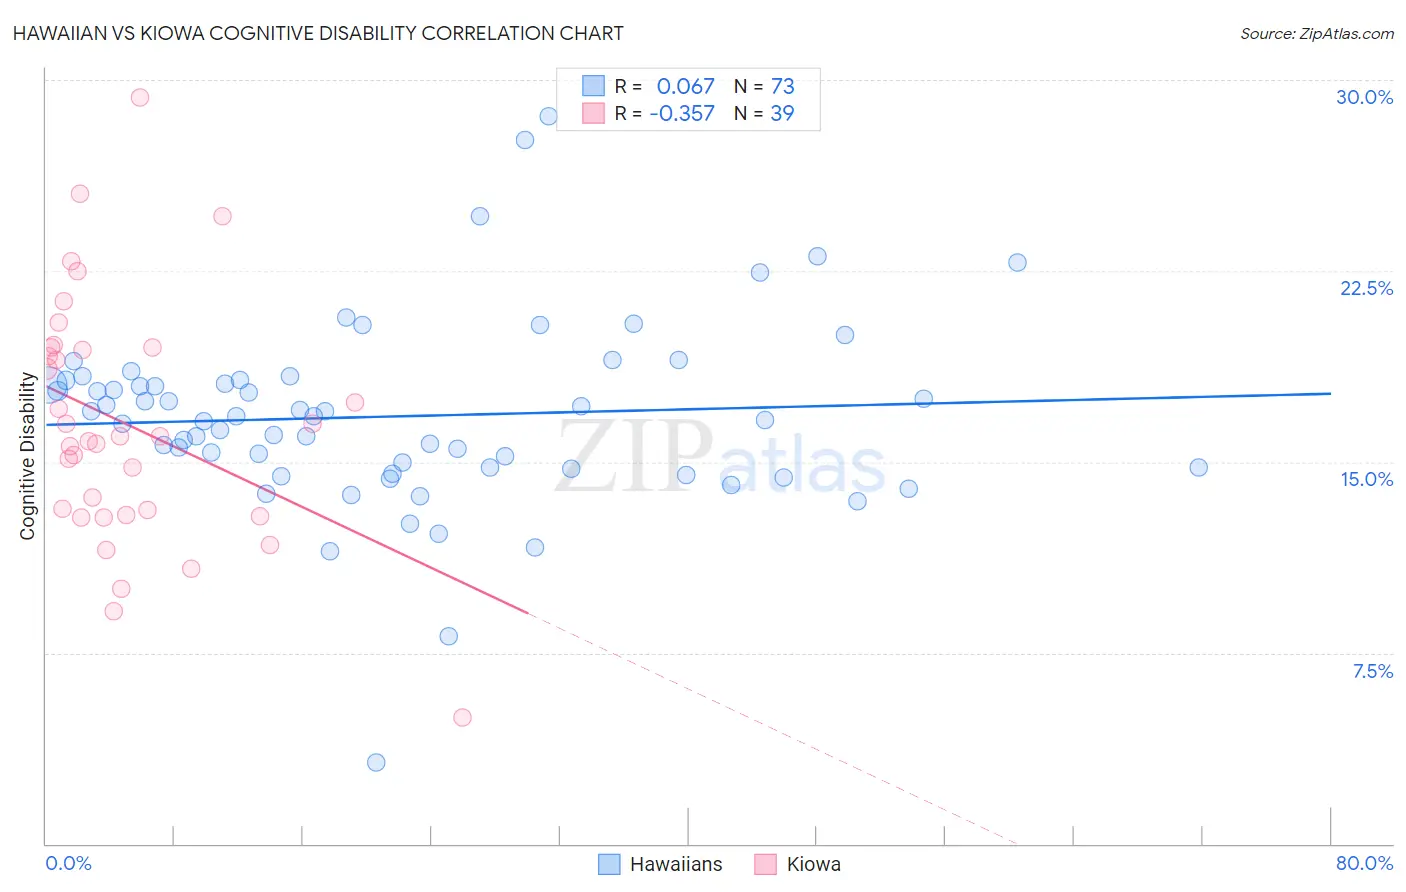
Hawaiian vs Kiowa Cognitive Disability Correlation Chart
The statistical analysis conducted on geographies consisting of 327,505,207 people shows a slight positive correlation between the proportion of Hawaiians and percentage of population with cognitive disability in the United States with a correlation coefficient (R) of 0.067 and weighted average of 17.6%. Similarly, the statistical analysis conducted on geographies consisting of 56,098,824 people shows a mild negative correlation between the proportion of Kiowa and percentage of population with cognitive disability in the United States with a correlation coefficient (R) of -0.357 and weighted average of 18.7%, a difference of 6.4%.
Cognitive Disability Correlation Summary
| Measurement | Hawaiian | Kiowa |
| Minimum | 3.2% | 4.9% |
| Maximum | 28.6% | 29.3% |
| Range | 25.4% | 24.4% |
| Mean | 16.8% | 16.5% |
| Median | 16.8% | 16.0% |
| Interquartile 25% (IQ1) | 14.7% | 12.9% |
| Interquartile 75% (IQ3) | 18.2% | 19.5% |
| Interquartile Range (IQR) | 3.5% | 6.6% |
| Standard Deviation (Sample) | 3.7% | 4.8% |
| Standard Deviation (Population) | 3.7% | 4.8% |
Similar Demographics by Cognitive Disability
Demographics Similar to Hawaiians by Cognitive Disability
In terms of cognitive disability, the demographic groups most similar to Hawaiians are Immigrants from Oceania (17.6%, a difference of 0.010%), Immigrants from El Salvador (17.6%, a difference of 0.020%), Alaskan Athabascan (17.6%, a difference of 0.030%), Okinawan (17.6%, a difference of 0.040%), and Taiwanese (17.6%, a difference of 0.050%).
| Demographics | Rating | Rank | Cognitive Disability |
| Alaska Natives | 10.4 /100 | #206 | Poor 17.5% |
| Immigrants | Latin America | 9.7 /100 | #207 | Tragic 17.6% |
| Immigrants | Cameroon | 9.3 /100 | #208 | Tragic 17.6% |
| Immigrants | Trinidad and Tobago | 8.7 /100 | #209 | Tragic 17.6% |
| Immigrants | Jamaica | 8.5 /100 | #210 | Tragic 17.6% |
| Taiwanese | 7.7 /100 | #211 | Tragic 17.6% |
| Immigrants | Oceania | 7.3 /100 | #212 | Tragic 17.6% |
| Hawaiians | 7.2 /100 | #213 | Tragic 17.6% |
| Immigrants | El Salvador | 7.0 /100 | #214 | Tragic 17.6% |
| Alaskan Athabascans | 6.9 /100 | #215 | Tragic 17.6% |
| Okinawans | 6.8 /100 | #216 | Tragic 17.6% |
| Salvadorans | 6.7 /100 | #217 | Tragic 17.6% |
| Icelanders | 6.4 /100 | #218 | Tragic 17.6% |
| Immigrants | Sierra Leone | 6.3 /100 | #219 | Tragic 17.6% |
| Zimbabweans | 6.1 /100 | #220 | Tragic 17.6% |
Demographics Similar to Kiowa by Cognitive Disability
In terms of cognitive disability, the demographic groups most similar to Kiowa are U.S. Virgin Islander (18.7%, a difference of 0.060%), Immigrants from Senegal (18.7%, a difference of 0.10%), Indonesian (18.7%, a difference of 0.12%), Dominican (18.7%, a difference of 0.20%), and Navajo (18.8%, a difference of 0.22%).
| Demographics | Rating | Rank | Cognitive Disability |
| Africans | 0.0 /100 | #321 | Tragic 18.6% |
| Immigrants | Liberia | 0.0 /100 | #322 | Tragic 18.7% |
| Pueblo | 0.0 /100 | #323 | Tragic 18.7% |
| Dominicans | 0.0 /100 | #324 | Tragic 18.7% |
| Indonesians | 0.0 /100 | #325 | Tragic 18.7% |
| Immigrants | Senegal | 0.0 /100 | #326 | Tragic 18.7% |
| U.S. Virgin Islanders | 0.0 /100 | #327 | Tragic 18.7% |
| Kiowa | 0.0 /100 | #328 | Tragic 18.7% |
| Navajo | 0.0 /100 | #329 | Tragic 18.8% |
| Immigrants | Dominican Republic | 0.0 /100 | #330 | Tragic 18.8% |
| Pima | 0.0 /100 | #331 | Tragic 18.8% |
| Immigrants | Sudan | 0.0 /100 | #332 | Tragic 18.8% |
| Immigrants | Yemen | 0.0 /100 | #333 | Tragic 18.8% |
| Sudanese | 0.0 /100 | #334 | Tragic 18.9% |
| Senegalese | 0.0 /100 | #335 | Tragic 19.0% |