Guatemalan vs Immigrants from Ethiopia Disability Age 65 to 74
COMPARE
Guatemalan
Immigrants from Ethiopia
Disability Age 65 to 74
Disability Age 65 to 74 Comparison
Guatemalans
Immigrants from Ethiopia
25.5%
DISABILITY AGE 65 TO 74
0.2/ 100
METRIC RATING
265th/ 347
METRIC RANK
22.7%
DISABILITY AGE 65 TO 74
85.3/ 100
METRIC RATING
142nd/ 347
METRIC RANK
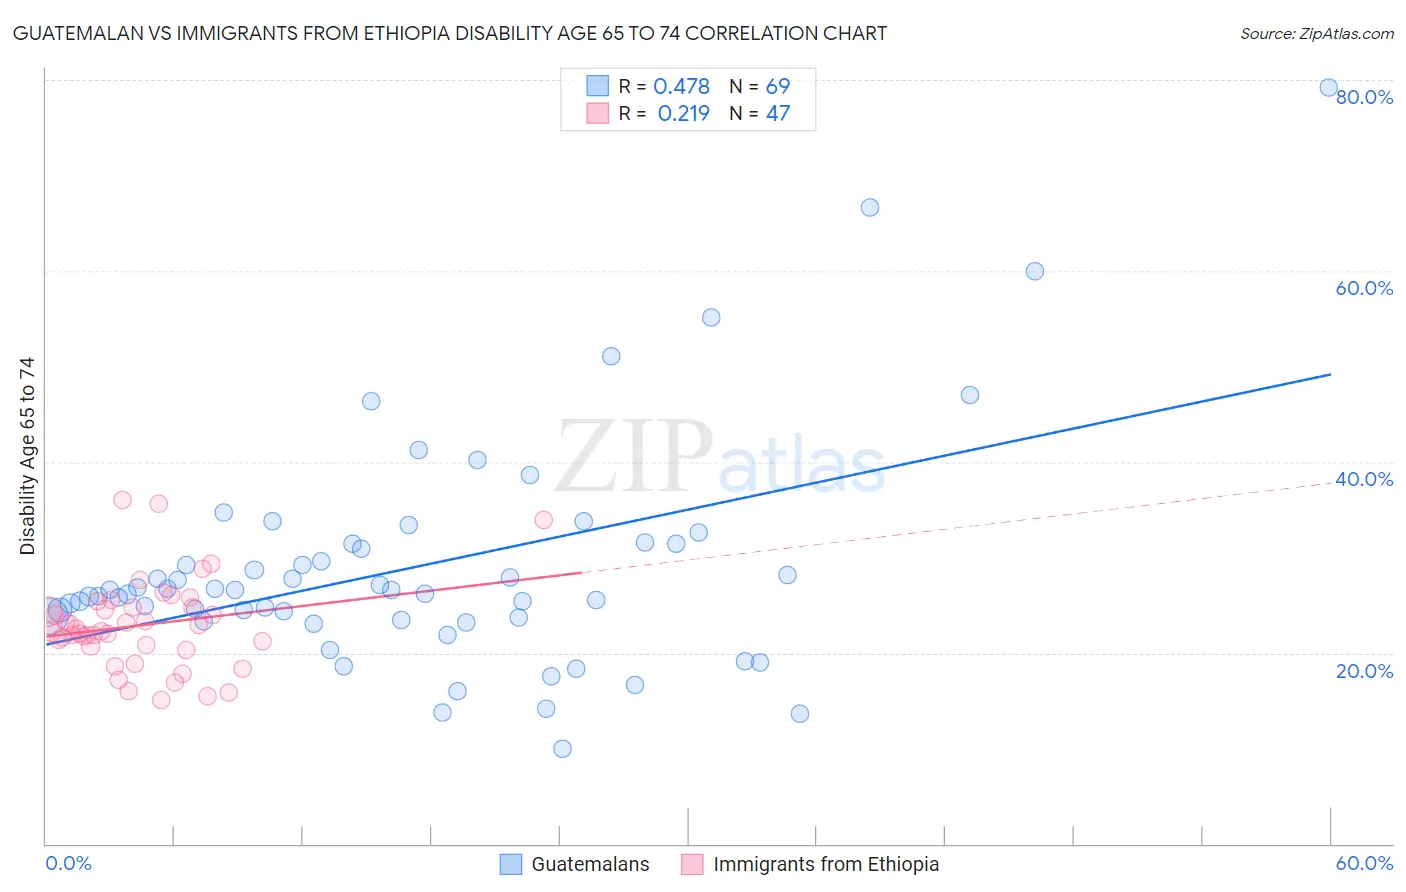
Guatemalan vs Immigrants from Ethiopia Disability Age 65 to 74 Correlation Chart
The statistical analysis conducted on geographies consisting of 408,717,949 people shows a moderate positive correlation between the proportion of Guatemalans and percentage of population with a disability between the ages 65 and 75 in the United States with a correlation coefficient (R) of 0.478 and weighted average of 25.5%. Similarly, the statistical analysis conducted on geographies consisting of 211,341,369 people shows a weak positive correlation between the proportion of Immigrants from Ethiopia and percentage of population with a disability between the ages 65 and 75 in the United States with a correlation coefficient (R) of 0.219 and weighted average of 22.7%, a difference of 12.3%.
Disability Age 65 to 74 Correlation Summary
| Measurement | Guatemalan | Immigrants from Ethiopia |
| Minimum | 10.0% | 15.1% |
| Maximum | 79.2% | 35.9% |
| Range | 69.2% | 20.9% |
| Mean | 29.0% | 22.9% |
| Median | 26.6% | 22.3% |
| Interquartile 25% (IQ1) | 23.6% | 20.7% |
| Interquartile 75% (IQ3) | 31.4% | 24.7% |
| Interquartile Range (IQR) | 7.8% | 4.0% |
| Standard Deviation (Sample) | 11.9% | 4.7% |
| Standard Deviation (Population) | 11.9% | 4.6% |
Similar Demographics by Disability Age 65 to 74
Demographics Similar to Guatemalans by Disability Age 65 to 74
In terms of disability age 65 to 74, the demographic groups most similar to Guatemalans are Hawaiian (25.5%, a difference of 0.050%), Immigrants from Latin America (25.6%, a difference of 0.080%), Ottawa (25.6%, a difference of 0.23%), Liberian (25.6%, a difference of 0.33%), and Iroquois (25.4%, a difference of 0.39%).
| Demographics | Rating | Rank | Disability Age 65 to 74 |
| Marshallese | 0.3 /100 | #258 | Tragic 25.3% |
| Immigrants | Cambodia | 0.3 /100 | #259 | Tragic 25.3% |
| Malaysians | 0.2 /100 | #260 | Tragic 25.4% |
| Cape Verdeans | 0.2 /100 | #261 | Tragic 25.4% |
| Samoans | 0.2 /100 | #262 | Tragic 25.4% |
| Iroquois | 0.2 /100 | #263 | Tragic 25.4% |
| Hawaiians | 0.2 /100 | #264 | Tragic 25.5% |
| Guatemalans | 0.2 /100 | #265 | Tragic 25.5% |
| Immigrants | Latin America | 0.1 /100 | #266 | Tragic 25.6% |
| Ottawa | 0.1 /100 | #267 | Tragic 25.6% |
| Liberians | 0.1 /100 | #268 | Tragic 25.6% |
| Hmong | 0.1 /100 | #269 | Tragic 25.7% |
| Immigrants | Guatemala | 0.1 /100 | #270 | Tragic 25.7% |
| Immigrants | Liberia | 0.1 /100 | #271 | Tragic 25.7% |
| Immigrants | Dominica | 0.1 /100 | #272 | Tragic 25.7% |
Demographics Similar to Immigrants from Ethiopia by Disability Age 65 to 74
In terms of disability age 65 to 74, the demographic groups most similar to Immigrants from Ethiopia are Belgian (22.7%, a difference of 0.010%), Ugandan (22.7%, a difference of 0.020%), Immigrants from Syria (22.7%, a difference of 0.060%), Arab (22.8%, a difference of 0.060%), and Danish (22.8%, a difference of 0.11%).
| Demographics | Rating | Rank | Disability Age 65 to 74 |
| Immigrants | Ukraine | 88.4 /100 | #135 | Excellent 22.6% |
| Ethiopians | 87.9 /100 | #136 | Excellent 22.7% |
| Taiwanese | 87.6 /100 | #137 | Excellent 22.7% |
| Immigrants | Moldova | 87.3 /100 | #138 | Excellent 22.7% |
| Immigrants | Syria | 85.8 /100 | #139 | Excellent 22.7% |
| Ugandans | 85.4 /100 | #140 | Excellent 22.7% |
| Belgians | 85.3 /100 | #141 | Excellent 22.7% |
| Immigrants | Ethiopia | 85.3 /100 | #142 | Excellent 22.7% |
| Arabs | 84.8 /100 | #143 | Excellent 22.8% |
| Danes | 84.4 /100 | #144 | Excellent 22.8% |
| Immigrants | Uganda | 84.0 /100 | #145 | Excellent 22.8% |
| Alsatians | 83.7 /100 | #146 | Excellent 22.8% |
| Immigrants | Uzbekistan | 83.1 /100 | #147 | Excellent 22.8% |
| New Zealanders | 79.9 /100 | #148 | Good 22.9% |
| Swiss | 79.7 /100 | #149 | Good 22.9% |