Greek vs Immigrants from Bosnia and Herzegovina Disability Age 18 to 34
COMPARE
Greek
Immigrants from Bosnia and Herzegovina
Disability Age 18 to 34
Disability Age 18 to 34 Comparison
Greeks
Immigrants from Bosnia and Herzegovina
6.8%
DISABILITY AGE 18 TO 34
16.1/ 100
METRIC RATING
201st/ 347
METRIC RANK
6.8%
DISABILITY AGE 18 TO 34
13.6/ 100
METRIC RATING
204th/ 347
METRIC RANK
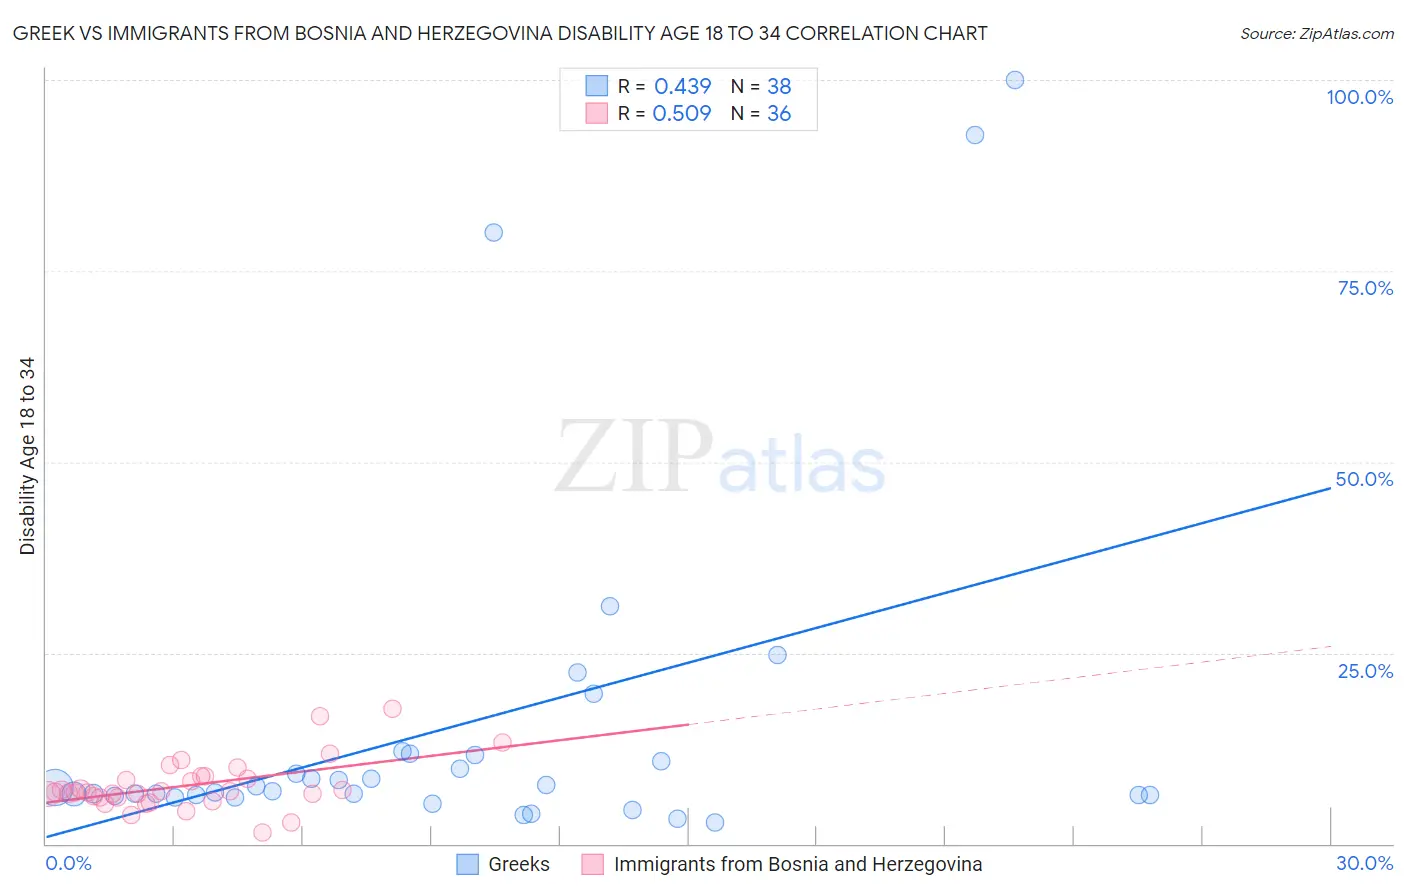
Greek vs Immigrants from Bosnia and Herzegovina Disability Age 18 to 34 Correlation Chart
The statistical analysis conducted on geographies consisting of 480,826,659 people shows a moderate positive correlation between the proportion of Greeks and percentage of population with a disability between the ages 18 and 35 in the United States with a correlation coefficient (R) of 0.439 and weighted average of 6.8%. Similarly, the statistical analysis conducted on geographies consisting of 156,744,323 people shows a substantial positive correlation between the proportion of Immigrants from Bosnia and Herzegovina and percentage of population with a disability between the ages 18 and 35 in the United States with a correlation coefficient (R) of 0.509 and weighted average of 6.8%, a difference of 0.33%.
Disability Age 18 to 34 Correlation Summary
| Measurement | Greek | Immigrants from Bosnia and Herzegovina |
| Minimum | 2.8% | 1.4% |
| Maximum | 100.0% | 17.6% |
| Range | 97.2% | 16.2% |
| Mean | 15.6% | 7.6% |
| Median | 7.1% | 6.8% |
| Interquartile 25% (IQ1) | 6.4% | 6.0% |
| Interquartile 75% (IQ3) | 11.7% | 8.7% |
| Interquartile Range (IQR) | 5.3% | 2.6% |
| Standard Deviation (Sample) | 23.3% | 3.3% |
| Standard Deviation (Population) | 23.0% | 3.3% |
Demographics Similar to Greeks and Immigrants from Bosnia and Herzegovina by Disability Age 18 to 34
In terms of disability age 18 to 34, the demographic groups most similar to Greeks are Panamanian (6.8%, a difference of 0.040%), Sierra Leonean (6.8%, a difference of 0.17%), Kenyan (6.8%, a difference of 0.26%), Hispanic or Latino (6.8%, a difference of 0.30%), and Lebanese (6.8%, a difference of 0.38%). Similarly, the demographic groups most similar to Immigrants from Bosnia and Herzegovina are Hispanic or Latino (6.8%, a difference of 0.020%), Lebanese (6.8%, a difference of 0.050%), Japanese (6.8%, a difference of 0.13%), Mexican (6.8%, a difference of 0.16%), and Immigrants from Scotland (6.8%, a difference of 0.18%).
| Demographics | Rating | Rank | Disability Age 18 to 34 |
| Immigrants | Western Africa | 28.3 /100 | #192 | Fair 6.7% |
| Immigrants | Uganda | 25.1 /100 | #193 | Fair 6.7% |
| Immigrants | Sudan | 24.9 /100 | #194 | Fair 6.7% |
| Mexican American Indians | 22.3 /100 | #195 | Fair 6.7% |
| Immigrants | Netherlands | 21.0 /100 | #196 | Fair 6.7% |
| Estonians | 20.6 /100 | #197 | Fair 6.8% |
| Australians | 19.4 /100 | #198 | Poor 6.8% |
| Kenyans | 18.3 /100 | #199 | Poor 6.8% |
| Sierra Leoneans | 17.5 /100 | #200 | Poor 6.8% |
| Greeks | 16.1 /100 | #201 | Poor 6.8% |
| Panamanians | 15.8 /100 | #202 | Poor 6.8% |
| Hispanics or Latinos | 13.8 /100 | #203 | Poor 6.8% |
| Immigrants | Bosnia and Herzegovina | 13.6 /100 | #204 | Poor 6.8% |
| Lebanese | 13.3 /100 | #205 | Poor 6.8% |
| Japanese | 12.8 /100 | #206 | Poor 6.8% |
| Mexicans | 12.6 /100 | #207 | Poor 6.8% |
| Immigrants | Scotland | 12.4 /100 | #208 | Poor 6.8% |
| Immigrants | Burma/Myanmar | 12.3 /100 | #209 | Poor 6.8% |
| Latvians | 11.1 /100 | #210 | Poor 6.8% |
| Immigrants | Norway | 10.0 /100 | #211 | Tragic 6.8% |
| Luxembourgers | 9.4 /100 | #212 | Tragic 6.9% |