South African vs Immigrants from Bosnia and Herzegovina Disability Age 18 to 34
COMPARE
South African
Immigrants from Bosnia and Herzegovina
Disability Age 18 to 34
Disability Age 18 to 34 Comparison
South Africans
Immigrants from Bosnia and Herzegovina
6.5%
DISABILITY AGE 18 TO 34
71.7/ 100
METRIC RATING
162nd/ 347
METRIC RANK
6.8%
DISABILITY AGE 18 TO 34
13.6/ 100
METRIC RATING
204th/ 347
METRIC RANK
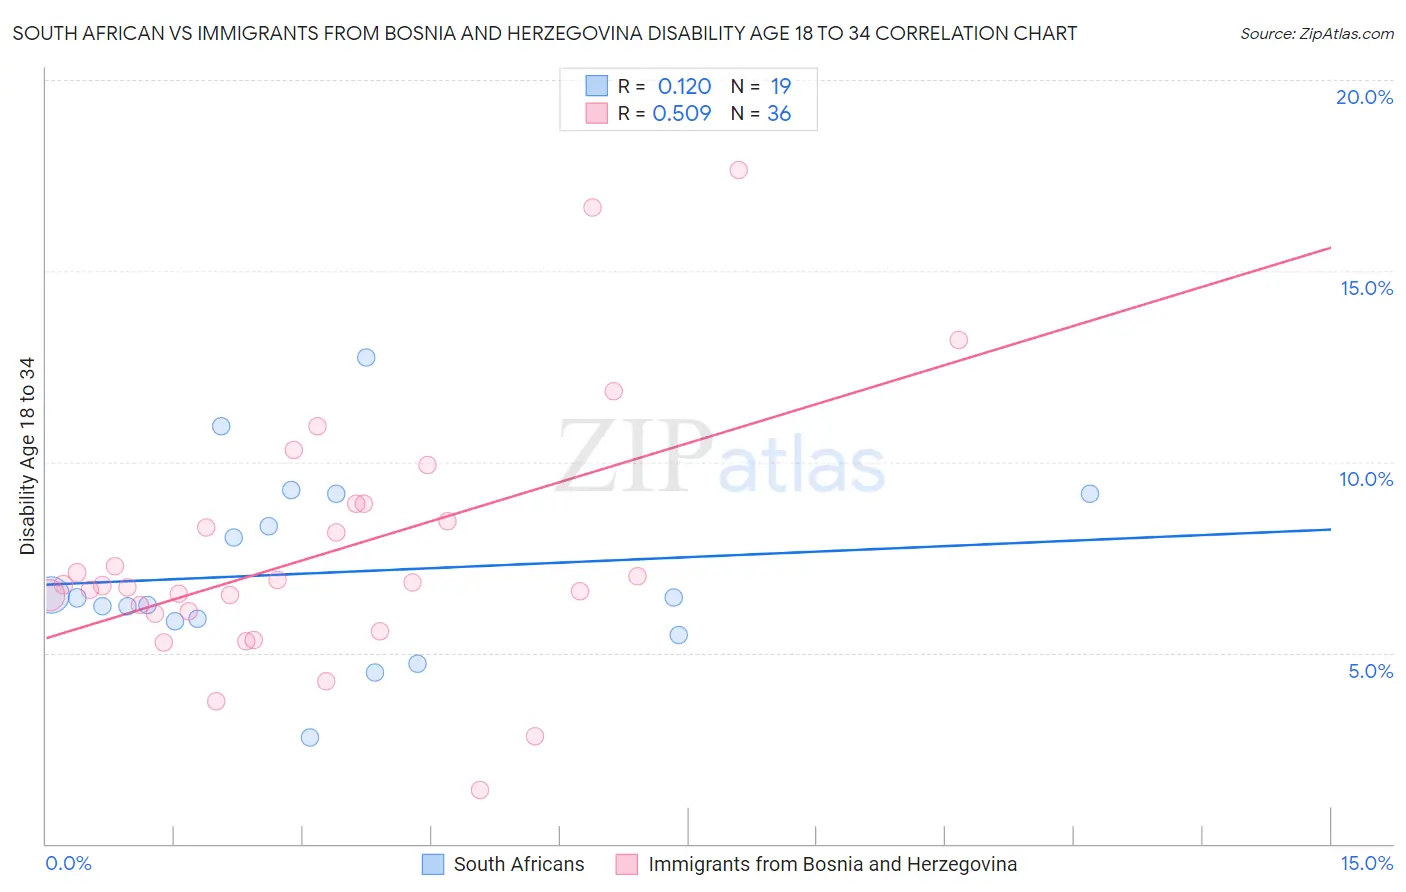
South African vs Immigrants from Bosnia and Herzegovina Disability Age 18 to 34 Correlation Chart
The statistical analysis conducted on geographies consisting of 182,336,959 people shows a poor positive correlation between the proportion of South Africans and percentage of population with a disability between the ages 18 and 35 in the United States with a correlation coefficient (R) of 0.120 and weighted average of 6.5%. Similarly, the statistical analysis conducted on geographies consisting of 156,744,323 people shows a substantial positive correlation between the proportion of Immigrants from Bosnia and Herzegovina and percentage of population with a disability between the ages 18 and 35 in the United States with a correlation coefficient (R) of 0.509 and weighted average of 6.8%, a difference of 4.9%.
Disability Age 18 to 34 Correlation Summary
| Measurement | South African | Immigrants from Bosnia and Herzegovina |
| Minimum | 2.8% | 1.4% |
| Maximum | 12.7% | 17.6% |
| Range | 9.9% | 16.2% |
| Mean | 7.1% | 7.6% |
| Median | 6.4% | 6.8% |
| Interquartile 25% (IQ1) | 5.8% | 6.0% |
| Interquartile 75% (IQ3) | 9.2% | 8.7% |
| Interquartile Range (IQR) | 3.3% | 2.6% |
| Standard Deviation (Sample) | 2.4% | 3.3% |
| Standard Deviation (Population) | 2.3% | 3.3% |
Similar Demographics by Disability Age 18 to 34
Demographics Similar to South Africans by Disability Age 18 to 34
In terms of disability age 18 to 34, the demographic groups most similar to South Africans are Immigrants from Denmark (6.5%, a difference of 0.0%), Arab (6.5%, a difference of 0.060%), Immigrants from Southern Europe (6.5%, a difference of 0.080%), Immigrants from Nigeria (6.5%, a difference of 0.11%), and Dominican (6.5%, a difference of 0.17%).
| Demographics | Rating | Rank | Disability Age 18 to 34 |
| Inupiat | 76.7 /100 | #155 | Good 6.5% |
| Immigrants | Panama | 75.3 /100 | #156 | Good 6.5% |
| Immigrants | Sierra Leone | 75.0 /100 | #157 | Good 6.5% |
| Zimbabweans | 74.7 /100 | #158 | Good 6.5% |
| Dominicans | 73.6 /100 | #159 | Good 6.5% |
| Immigrants | Southern Europe | 72.5 /100 | #160 | Good 6.5% |
| Arabs | 72.3 /100 | #161 | Good 6.5% |
| South Africans | 71.7 /100 | #162 | Good 6.5% |
| Immigrants | Denmark | 71.7 /100 | #163 | Good 6.5% |
| Immigrants | Nigeria | 70.4 /100 | #164 | Good 6.5% |
| Immigrants | Hungary | 69.6 /100 | #165 | Good 6.5% |
| Eastern Europeans | 65.1 /100 | #166 | Good 6.5% |
| Immigrants | Northern Europe | 64.1 /100 | #167 | Good 6.5% |
| Immigrants | Moldova | 63.1 /100 | #168 | Good 6.5% |
| Russians | 60.2 /100 | #169 | Good 6.5% |
Demographics Similar to Immigrants from Bosnia and Herzegovina by Disability Age 18 to 34
In terms of disability age 18 to 34, the demographic groups most similar to Immigrants from Bosnia and Herzegovina are Hispanic or Latino (6.8%, a difference of 0.020%), Lebanese (6.8%, a difference of 0.050%), Japanese (6.8%, a difference of 0.13%), Mexican (6.8%, a difference of 0.16%), and Immigrants from Scotland (6.8%, a difference of 0.18%).
| Demographics | Rating | Rank | Disability Age 18 to 34 |
| Estonians | 20.6 /100 | #197 | Fair 6.8% |
| Australians | 19.4 /100 | #198 | Poor 6.8% |
| Kenyans | 18.3 /100 | #199 | Poor 6.8% |
| Sierra Leoneans | 17.5 /100 | #200 | Poor 6.8% |
| Greeks | 16.1 /100 | #201 | Poor 6.8% |
| Panamanians | 15.8 /100 | #202 | Poor 6.8% |
| Hispanics or Latinos | 13.8 /100 | #203 | Poor 6.8% |
| Immigrants | Bosnia and Herzegovina | 13.6 /100 | #204 | Poor 6.8% |
| Lebanese | 13.3 /100 | #205 | Poor 6.8% |
| Japanese | 12.8 /100 | #206 | Poor 6.8% |
| Mexicans | 12.6 /100 | #207 | Poor 6.8% |
| Immigrants | Scotland | 12.4 /100 | #208 | Poor 6.8% |
| Immigrants | Burma/Myanmar | 12.3 /100 | #209 | Poor 6.8% |
| Latvians | 11.1 /100 | #210 | Poor 6.8% |
| Immigrants | Norway | 10.0 /100 | #211 | Tragic 6.8% |