Immigrants from Bahamas vs Immigrants from Bosnia and Herzegovina Disability Age 18 to 34
COMPARE
Immigrants from Bahamas
Immigrants from Bosnia and Herzegovina
Disability Age 18 to 34
Disability Age 18 to 34 Comparison
Immigrants from Bahamas
Immigrants from Bosnia and Herzegovina
6.6%
DISABILITY AGE 18 TO 34
57.9/ 100
METRIC RATING
170th/ 347
METRIC RANK
6.8%
DISABILITY AGE 18 TO 34
13.6/ 100
METRIC RATING
204th/ 347
METRIC RANK
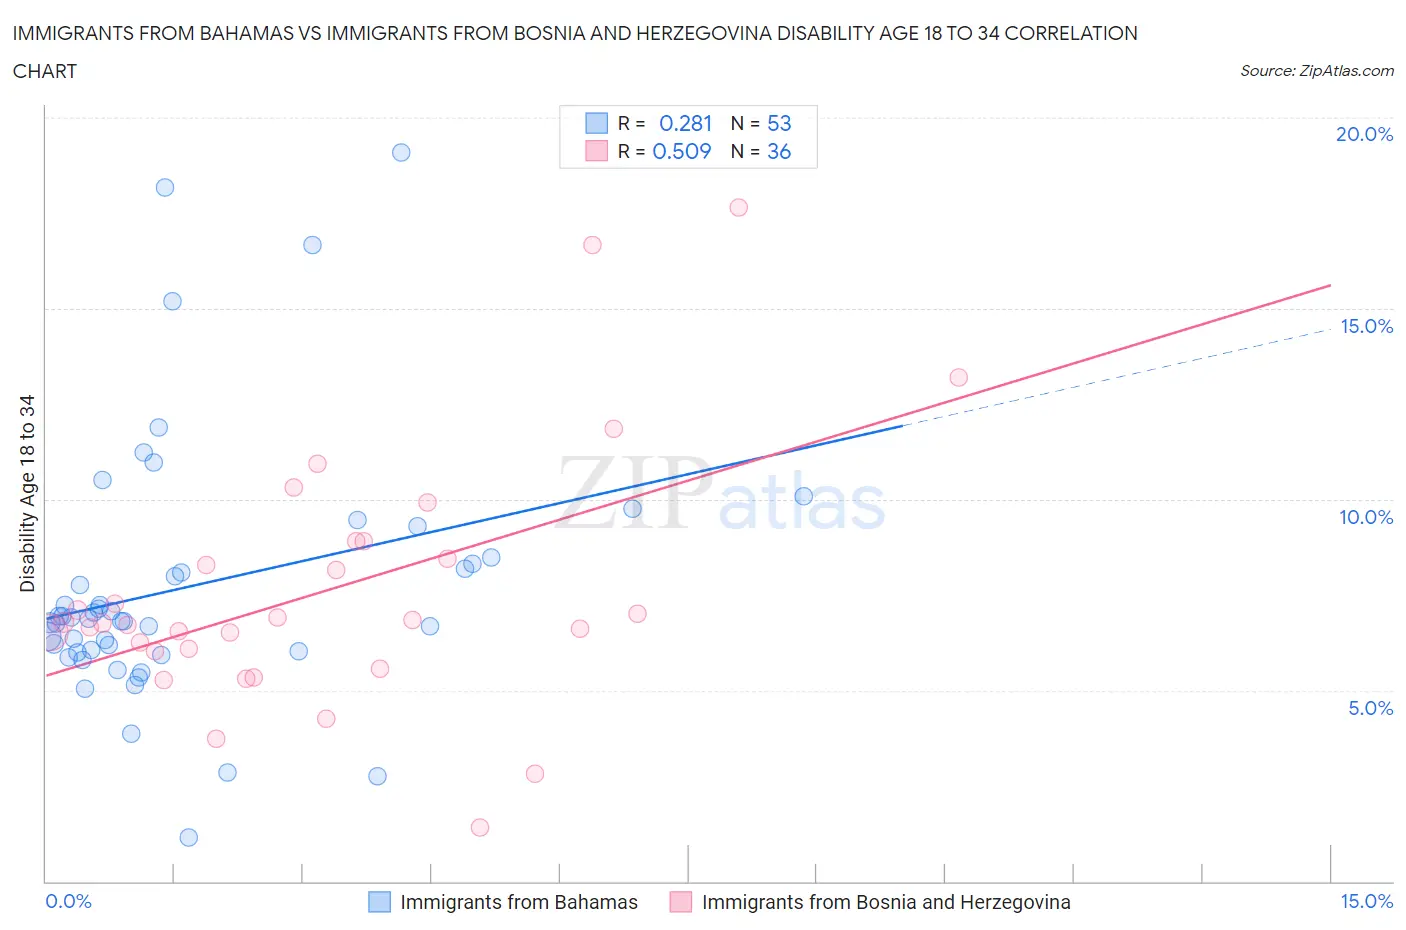
Immigrants from Bahamas vs Immigrants from Bosnia and Herzegovina Disability Age 18 to 34 Correlation Chart
The statistical analysis conducted on geographies consisting of 104,633,448 people shows a weak positive correlation between the proportion of Immigrants from Bahamas and percentage of population with a disability between the ages 18 and 35 in the United States with a correlation coefficient (R) of 0.281 and weighted average of 6.6%. Similarly, the statistical analysis conducted on geographies consisting of 156,744,323 people shows a substantial positive correlation between the proportion of Immigrants from Bosnia and Herzegovina and percentage of population with a disability between the ages 18 and 35 in the United States with a correlation coefficient (R) of 0.509 and weighted average of 6.8%, a difference of 3.8%.
Disability Age 18 to 34 Correlation Summary
| Measurement | Immigrants from Bahamas | Immigrants from Bosnia and Herzegovina |
| Minimum | 1.2% | 1.4% |
| Maximum | 19.1% | 17.6% |
| Range | 17.9% | 16.2% |
| Mean | 7.7% | 7.6% |
| Median | 6.9% | 6.8% |
| Interquartile 25% (IQ1) | 6.0% | 6.0% |
| Interquartile 75% (IQ3) | 8.4% | 8.7% |
| Interquartile Range (IQR) | 2.4% | 2.6% |
| Standard Deviation (Sample) | 3.4% | 3.3% |
| Standard Deviation (Population) | 3.4% | 3.3% |
Similar Demographics by Disability Age 18 to 34
Demographics Similar to Immigrants from Bahamas by Disability Age 18 to 34
In terms of disability age 18 to 34, the demographic groups most similar to Immigrants from Bahamas are Russian (6.5%, a difference of 0.17%), Bahamian (6.6%, a difference of 0.17%), Ghanaian (6.6%, a difference of 0.22%), Immigrants from Mexico (6.6%, a difference of 0.27%), and Immigrants from Moldova (6.5%, a difference of 0.38%).
| Demographics | Rating | Rank | Disability Age 18 to 34 |
| Immigrants | Denmark | 71.7 /100 | #163 | Good 6.5% |
| Immigrants | Nigeria | 70.4 /100 | #164 | Good 6.5% |
| Immigrants | Hungary | 69.6 /100 | #165 | Good 6.5% |
| Eastern Europeans | 65.1 /100 | #166 | Good 6.5% |
| Immigrants | Northern Europe | 64.1 /100 | #167 | Good 6.5% |
| Immigrants | Moldova | 63.1 /100 | #168 | Good 6.5% |
| Russians | 60.2 /100 | #169 | Good 6.5% |
| Immigrants | Bahamas | 57.9 /100 | #170 | Average 6.6% |
| Bahamians | 55.5 /100 | #171 | Average 6.6% |
| Ghanaians | 54.7 /100 | #172 | Average 6.6% |
| Immigrants | Mexico | 54.1 /100 | #173 | Average 6.6% |
| Native Hawaiians | 50.0 /100 | #174 | Average 6.6% |
| Immigrants | Cambodia | 46.5 /100 | #175 | Average 6.6% |
| Immigrants | Africa | 45.9 /100 | #176 | Average 6.6% |
| Syrians | 44.3 /100 | #177 | Average 6.6% |
Demographics Similar to Immigrants from Bosnia and Herzegovina by Disability Age 18 to 34
In terms of disability age 18 to 34, the demographic groups most similar to Immigrants from Bosnia and Herzegovina are Hispanic or Latino (6.8%, a difference of 0.020%), Lebanese (6.8%, a difference of 0.050%), Japanese (6.8%, a difference of 0.13%), Mexican (6.8%, a difference of 0.16%), and Immigrants from Scotland (6.8%, a difference of 0.18%).
| Demographics | Rating | Rank | Disability Age 18 to 34 |
| Estonians | 20.6 /100 | #197 | Fair 6.8% |
| Australians | 19.4 /100 | #198 | Poor 6.8% |
| Kenyans | 18.3 /100 | #199 | Poor 6.8% |
| Sierra Leoneans | 17.5 /100 | #200 | Poor 6.8% |
| Greeks | 16.1 /100 | #201 | Poor 6.8% |
| Panamanians | 15.8 /100 | #202 | Poor 6.8% |
| Hispanics or Latinos | 13.8 /100 | #203 | Poor 6.8% |
| Immigrants | Bosnia and Herzegovina | 13.6 /100 | #204 | Poor 6.8% |
| Lebanese | 13.3 /100 | #205 | Poor 6.8% |
| Japanese | 12.8 /100 | #206 | Poor 6.8% |
| Mexicans | 12.6 /100 | #207 | Poor 6.8% |
| Immigrants | Scotland | 12.4 /100 | #208 | Poor 6.8% |
| Immigrants | Burma/Myanmar | 12.3 /100 | #209 | Poor 6.8% |
| Latvians | 11.1 /100 | #210 | Poor 6.8% |
| Immigrants | Norway | 10.0 /100 | #211 | Tragic 6.8% |