Immigrants from Cameroon vs Immigrants from Bosnia and Herzegovina Disability Age 18 to 34
COMPARE
Immigrants from Cameroon
Immigrants from Bosnia and Herzegovina
Disability Age 18 to 34
Disability Age 18 to 34 Comparison
Immigrants from Cameroon
Immigrants from Bosnia and Herzegovina
6.7%
DISABILITY AGE 18 TO 34
34.5/ 100
METRIC RATING
188th/ 347
METRIC RANK
6.8%
DISABILITY AGE 18 TO 34
13.6/ 100
METRIC RATING
204th/ 347
METRIC RANK
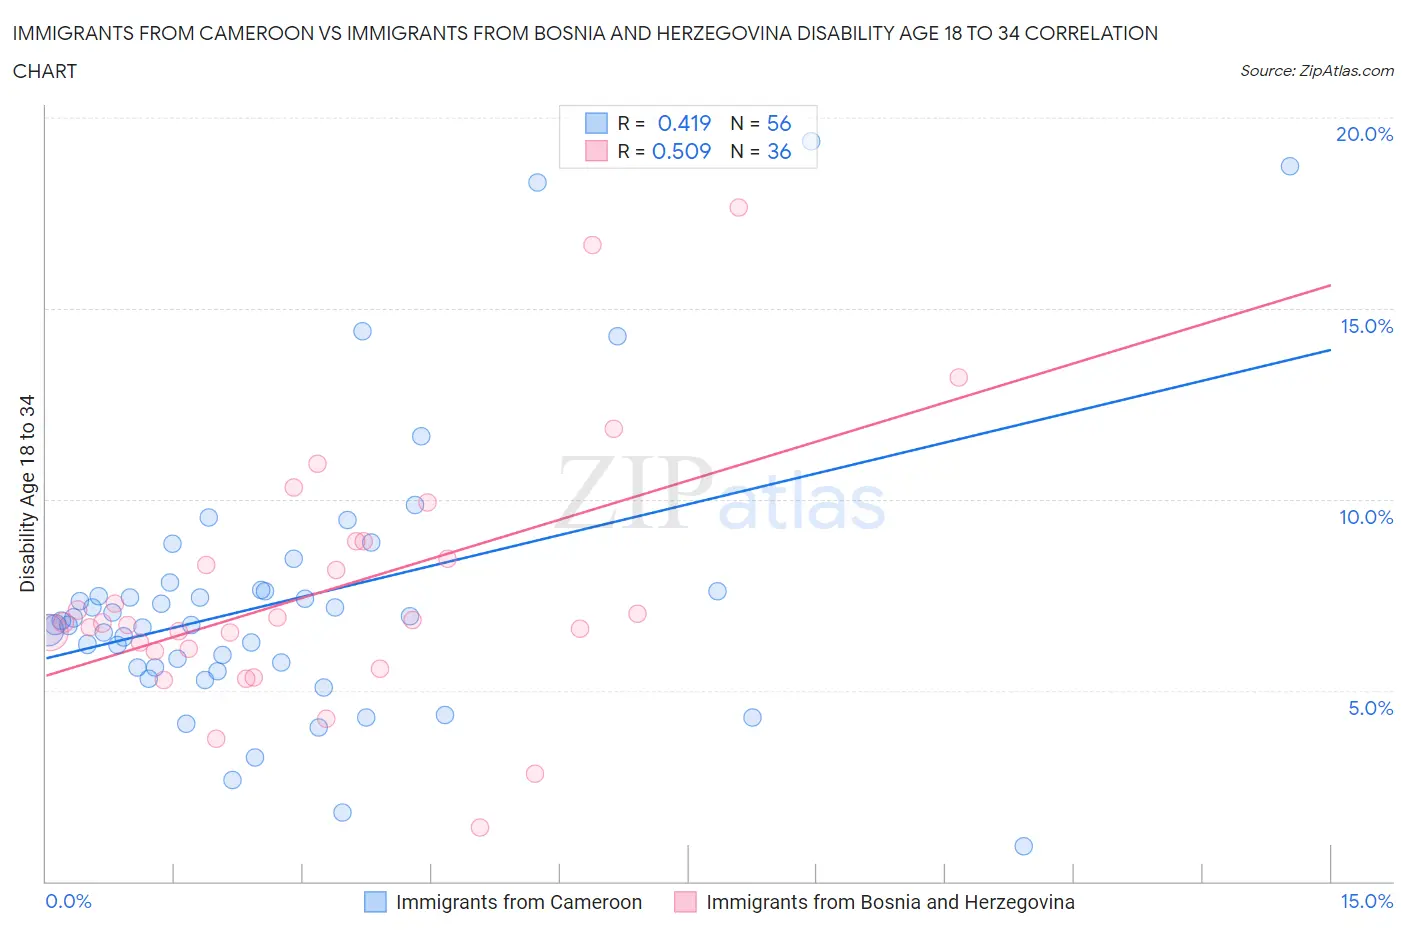
Immigrants from Cameroon vs Immigrants from Bosnia and Herzegovina Disability Age 18 to 34 Correlation Chart
The statistical analysis conducted on geographies consisting of 130,717,847 people shows a moderate positive correlation between the proportion of Immigrants from Cameroon and percentage of population with a disability between the ages 18 and 35 in the United States with a correlation coefficient (R) of 0.419 and weighted average of 6.7%. Similarly, the statistical analysis conducted on geographies consisting of 156,744,323 people shows a substantial positive correlation between the proportion of Immigrants from Bosnia and Herzegovina and percentage of population with a disability between the ages 18 and 35 in the United States with a correlation coefficient (R) of 0.509 and weighted average of 6.8%, a difference of 2.1%.
Disability Age 18 to 34 Correlation Summary
| Measurement | Immigrants from Cameroon | Immigrants from Bosnia and Herzegovina |
| Minimum | 0.90% | 1.4% |
| Maximum | 19.4% | 17.6% |
| Range | 18.5% | 16.2% |
| Mean | 7.4% | 7.6% |
| Median | 6.8% | 6.8% |
| Interquartile 25% (IQ1) | 5.6% | 6.0% |
| Interquartile 75% (IQ3) | 7.6% | 8.7% |
| Interquartile Range (IQR) | 2.0% | 2.6% |
| Standard Deviation (Sample) | 3.6% | 3.3% |
| Standard Deviation (Population) | 3.6% | 3.3% |
Demographics Similar to Immigrants from Cameroon and Immigrants from Bosnia and Herzegovina by Disability Age 18 to 34
In terms of disability age 18 to 34, the demographic groups most similar to Immigrants from Cameroon are Maltese (6.7%, a difference of 0.020%), Yup'ik (6.7%, a difference of 0.060%), Pakistani (6.7%, a difference of 0.060%), Immigrants from Zimbabwe (6.7%, a difference of 0.070%), and Immigrants from Eastern Africa (6.7%, a difference of 0.10%). Similarly, the demographic groups most similar to Immigrants from Bosnia and Herzegovina are Hispanic or Latino (6.8%, a difference of 0.020%), Lebanese (6.8%, a difference of 0.050%), Japanese (6.8%, a difference of 0.13%), Panamanian (6.8%, a difference of 0.29%), and Greek (6.8%, a difference of 0.33%).
| Demographics | Rating | Rank | Disability Age 18 to 34 |
| Yup'ik | 35.3 /100 | #186 | Fair 6.7% |
| Maltese | 34.8 /100 | #187 | Fair 6.7% |
| Immigrants | Cameroon | 34.5 /100 | #188 | Fair 6.7% |
| Pakistanis | 33.7 /100 | #189 | Fair 6.7% |
| Immigrants | Zimbabwe | 33.6 /100 | #190 | Fair 6.7% |
| Immigrants | Eastern Africa | 33.2 /100 | #191 | Fair 6.7% |
| Immigrants | Western Africa | 28.3 /100 | #192 | Fair 6.7% |
| Immigrants | Uganda | 25.1 /100 | #193 | Fair 6.7% |
| Immigrants | Sudan | 24.9 /100 | #194 | Fair 6.7% |
| Mexican American Indians | 22.3 /100 | #195 | Fair 6.7% |
| Immigrants | Netherlands | 21.0 /100 | #196 | Fair 6.7% |
| Estonians | 20.6 /100 | #197 | Fair 6.8% |
| Australians | 19.4 /100 | #198 | Poor 6.8% |
| Kenyans | 18.3 /100 | #199 | Poor 6.8% |
| Sierra Leoneans | 17.5 /100 | #200 | Poor 6.8% |
| Greeks | 16.1 /100 | #201 | Poor 6.8% |
| Panamanians | 15.8 /100 | #202 | Poor 6.8% |
| Hispanics or Latinos | 13.8 /100 | #203 | Poor 6.8% |
| Immigrants | Bosnia and Herzegovina | 13.6 /100 | #204 | Poor 6.8% |
| Lebanese | 13.3 /100 | #205 | Poor 6.8% |
| Japanese | 12.8 /100 | #206 | Poor 6.8% |