Greek vs Colville Disability Age 18 to 34
COMPARE
Greek
Colville
Disability Age 18 to 34
Disability Age 18 to 34 Comparison
Greeks
Colville
6.8%
DISABILITY AGE 18 TO 34
16.1/ 100
METRIC RATING
201st/ 347
METRIC RANK
7.9%
DISABILITY AGE 18 TO 34
0.0/ 100
METRIC RATING
314th/ 347
METRIC RANK
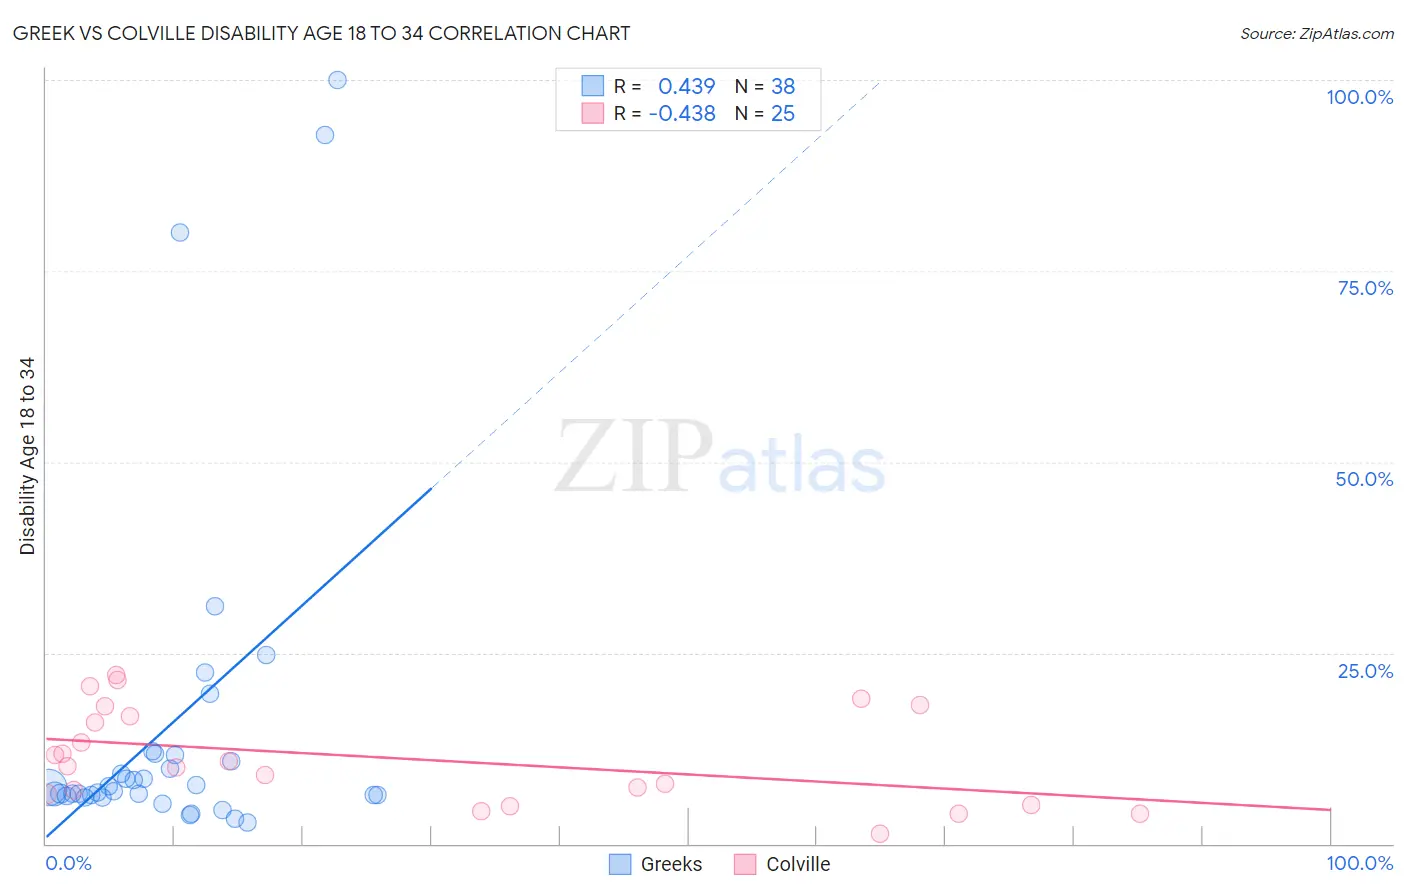
Greek vs Colville Disability Age 18 to 34 Correlation Chart
The statistical analysis conducted on geographies consisting of 480,826,659 people shows a moderate positive correlation between the proportion of Greeks and percentage of population with a disability between the ages 18 and 35 in the United States with a correlation coefficient (R) of 0.439 and weighted average of 6.8%. Similarly, the statistical analysis conducted on geographies consisting of 34,674,811 people shows a moderate negative correlation between the proportion of Colville and percentage of population with a disability between the ages 18 and 35 in the United States with a correlation coefficient (R) of -0.438 and weighted average of 7.9%, a difference of 17.0%.
Disability Age 18 to 34 Correlation Summary
| Measurement | Greek | Colville |
| Minimum | 2.8% | 1.4% |
| Maximum | 100.0% | 22.1% |
| Range | 97.2% | 20.7% |
| Mean | 15.6% | 11.2% |
| Median | 7.1% | 10.2% |
| Interquartile 25% (IQ1) | 6.4% | 5.7% |
| Interquartile 75% (IQ3) | 11.7% | 17.3% |
| Interquartile Range (IQR) | 5.3% | 11.6% |
| Standard Deviation (Sample) | 23.3% | 6.2% |
| Standard Deviation (Population) | 23.0% | 6.1% |
Similar Demographics by Disability Age 18 to 34
Demographics Similar to Greeks by Disability Age 18 to 34
In terms of disability age 18 to 34, the demographic groups most similar to Greeks are Panamanian (6.8%, a difference of 0.040%), Sierra Leonean (6.8%, a difference of 0.17%), Kenyan (6.8%, a difference of 0.26%), Hispanic or Latino (6.8%, a difference of 0.30%), and Immigrants from Bosnia and Herzegovina (6.8%, a difference of 0.33%).
| Demographics | Rating | Rank | Disability Age 18 to 34 |
| Immigrants | Sudan | 24.9 /100 | #194 | Fair 6.7% |
| Mexican American Indians | 22.3 /100 | #195 | Fair 6.7% |
| Immigrants | Netherlands | 21.0 /100 | #196 | Fair 6.7% |
| Estonians | 20.6 /100 | #197 | Fair 6.8% |
| Australians | 19.4 /100 | #198 | Poor 6.8% |
| Kenyans | 18.3 /100 | #199 | Poor 6.8% |
| Sierra Leoneans | 17.5 /100 | #200 | Poor 6.8% |
| Greeks | 16.1 /100 | #201 | Poor 6.8% |
| Panamanians | 15.8 /100 | #202 | Poor 6.8% |
| Hispanics or Latinos | 13.8 /100 | #203 | Poor 6.8% |
| Immigrants | Bosnia and Herzegovina | 13.6 /100 | #204 | Poor 6.8% |
| Lebanese | 13.3 /100 | #205 | Poor 6.8% |
| Japanese | 12.8 /100 | #206 | Poor 6.8% |
| Mexicans | 12.6 /100 | #207 | Poor 6.8% |
| Immigrants | Scotland | 12.4 /100 | #208 | Poor 6.8% |
Demographics Similar to Colville by Disability Age 18 to 34
In terms of disability age 18 to 34, the demographic groups most similar to Colville are Iroquois (7.9%, a difference of 0.44%), Spanish American (7.9%, a difference of 0.48%), American (8.0%, a difference of 0.72%), French (7.9%, a difference of 0.84%), and Puerto Rican (8.0%, a difference of 0.98%).
| Demographics | Rating | Rank | Disability Age 18 to 34 |
| Scotch-Irish | 0.0 /100 | #307 | Tragic 7.8% |
| Pennsylvania Germans | 0.0 /100 | #308 | Tragic 7.8% |
| Alaska Natives | 0.0 /100 | #309 | Tragic 7.8% |
| Finns | 0.0 /100 | #310 | Tragic 7.8% |
| French | 0.0 /100 | #311 | Tragic 7.9% |
| Spanish Americans | 0.0 /100 | #312 | Tragic 7.9% |
| Iroquois | 0.0 /100 | #313 | Tragic 7.9% |
| Colville | 0.0 /100 | #314 | Tragic 7.9% |
| Americans | 0.0 /100 | #315 | Tragic 8.0% |
| Puerto Ricans | 0.0 /100 | #316 | Tragic 8.0% |
| Hmong | 0.0 /100 | #317 | Tragic 8.1% |
| French Canadians | 0.0 /100 | #318 | Tragic 8.1% |
| Aleuts | 0.0 /100 | #319 | Tragic 8.1% |
| Navajo | 0.0 /100 | #320 | Tragic 8.1% |
| Blackfeet | 0.0 /100 | #321 | Tragic 8.1% |