Ghanaian vs Basque Hearing Disability
COMPARE
Ghanaian
Basque
Hearing Disability
Hearing Disability Comparison
Ghanaians
Basques
2.5%
HEARING DISABILITY
99.8/ 100
METRIC RATING
21st/ 347
METRIC RANK
3.6%
HEARING DISABILITY
0.0/ 100
METRIC RATING
278th/ 347
METRIC RANK
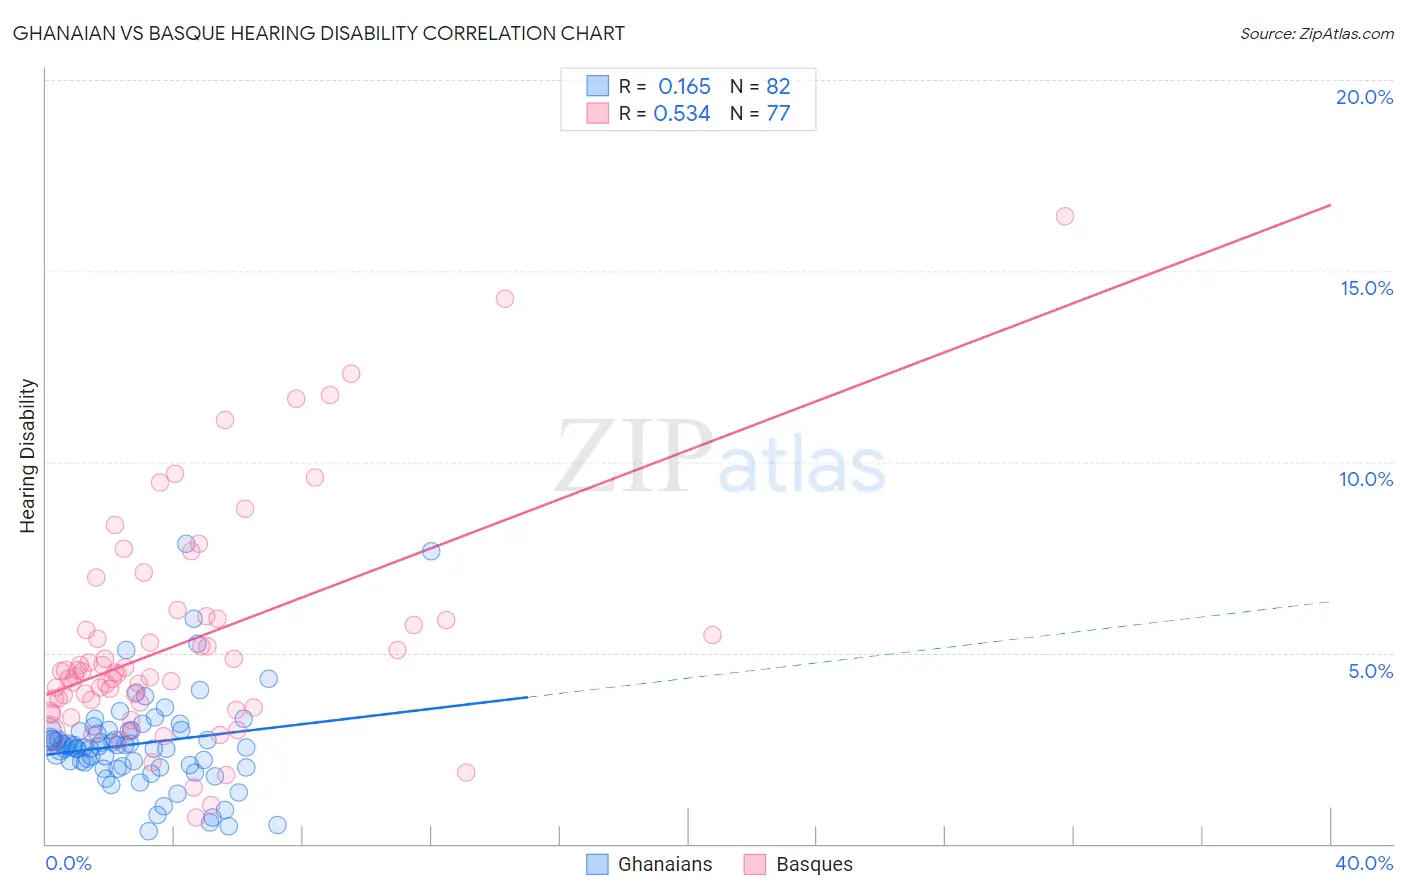
Ghanaian vs Basque Hearing Disability Correlation Chart
The statistical analysis conducted on geographies consisting of 190,612,767 people shows a poor positive correlation between the proportion of Ghanaians and percentage of population with hearing disability in the United States with a correlation coefficient (R) of 0.165 and weighted average of 2.5%. Similarly, the statistical analysis conducted on geographies consisting of 165,769,952 people shows a substantial positive correlation between the proportion of Basques and percentage of population with hearing disability in the United States with a correlation coefficient (R) of 0.534 and weighted average of 3.6%, a difference of 41.0%.
Hearing Disability Correlation Summary
| Measurement | Ghanaian | Basque |
| Minimum | 0.32% | 0.68% |
| Maximum | 7.9% | 16.4% |
| Range | 7.5% | 15.7% |
| Mean | 2.6% | 5.3% |
| Median | 2.5% | 4.5% |
| Interquartile 25% (IQ1) | 2.0% | 3.6% |
| Interquartile 75% (IQ3) | 3.0% | 5.9% |
| Interquartile Range (IQR) | 0.92% | 2.2% |
| Standard Deviation (Sample) | 1.3% | 2.9% |
| Standard Deviation (Population) | 1.3% | 2.9% |
Similar Demographics by Hearing Disability
Demographics Similar to Ghanaians by Hearing Disability
In terms of hearing disability, the demographic groups most similar to Ghanaians are Immigrants from Sierra Leone (2.6%, a difference of 0.040%), Immigrants from Bolivia (2.5%, a difference of 0.070%), Thai (2.5%, a difference of 0.11%), Dominican (2.5%, a difference of 0.14%), and Immigrants from Nigeria (2.6%, a difference of 0.54%).
| Demographics | Rating | Rank | Hearing Disability |
| Ecuadorians | 99.9 /100 | #14 | Exceptional 2.5% |
| Barbadians | 99.9 /100 | #15 | Exceptional 2.5% |
| Immigrants | West Indies | 99.9 /100 | #16 | Exceptional 2.5% |
| Immigrants | India | 99.9 /100 | #17 | Exceptional 2.5% |
| Dominicans | 99.8 /100 | #18 | Exceptional 2.5% |
| Thais | 99.8 /100 | #19 | Exceptional 2.5% |
| Immigrants | Bolivia | 99.8 /100 | #20 | Exceptional 2.5% |
| Ghanaians | 99.8 /100 | #21 | Exceptional 2.5% |
| Immigrants | Sierra Leone | 99.8 /100 | #22 | Exceptional 2.6% |
| Immigrants | Nigeria | 99.8 /100 | #23 | Exceptional 2.6% |
| Immigrants | Ghana | 99.8 /100 | #24 | Exceptional 2.6% |
| Immigrants | El Salvador | 99.7 /100 | #25 | Exceptional 2.6% |
| Immigrants | Senegal | 99.7 /100 | #26 | Exceptional 2.6% |
| Immigrants | South Central Asia | 99.7 /100 | #27 | Exceptional 2.6% |
| Immigrants | Haiti | 99.7 /100 | #28 | Exceptional 2.6% |
Demographics Similar to Basques by Hearing Disability
In terms of hearing disability, the demographic groups most similar to Basques are Slovak (3.6%, a difference of 0.26%), French American Indian (3.6%, a difference of 0.33%), Nonimmigrants (3.6%, a difference of 0.39%), Scandinavian (3.6%, a difference of 0.39%), and Swedish (3.6%, a difference of 0.48%).
| Demographics | Rating | Rank | Hearing Disability |
| Czechs | 0.1 /100 | #271 | Tragic 3.5% |
| Fijians | 0.0 /100 | #272 | Tragic 3.5% |
| Puerto Ricans | 0.0 /100 | #273 | Tragic 3.5% |
| Swiss | 0.0 /100 | #274 | Tragic 3.5% |
| Czechoslovakians | 0.0 /100 | #275 | Tragic 3.6% |
| Danes | 0.0 /100 | #276 | Tragic 3.6% |
| Immigrants | Nonimmigrants | 0.0 /100 | #277 | Tragic 3.6% |
| Basques | 0.0 /100 | #278 | Tragic 3.6% |
| Slovaks | 0.0 /100 | #279 | Tragic 3.6% |
| French American Indians | 0.0 /100 | #280 | Tragic 3.6% |
| Scandinavians | 0.0 /100 | #281 | Tragic 3.6% |
| Swedes | 0.0 /100 | #282 | Tragic 3.6% |
| Blackfeet | 0.0 /100 | #283 | Tragic 3.6% |
| Immigrants | Micronesia | 0.0 /100 | #284 | Tragic 3.6% |
| Sioux | 0.0 /100 | #285 | Tragic 3.6% |