Ghanaian vs Immigrants from France Hearing Disability
COMPARE
Ghanaian
Immigrants from France
Hearing Disability
Hearing Disability Comparison
Ghanaians
Immigrants from France
2.5%
HEARING DISABILITY
99.8/ 100
METRIC RATING
21st/ 347
METRIC RANK
2.9%
HEARING DISABILITY
73.1/ 100
METRIC RATING
151st/ 347
METRIC RANK
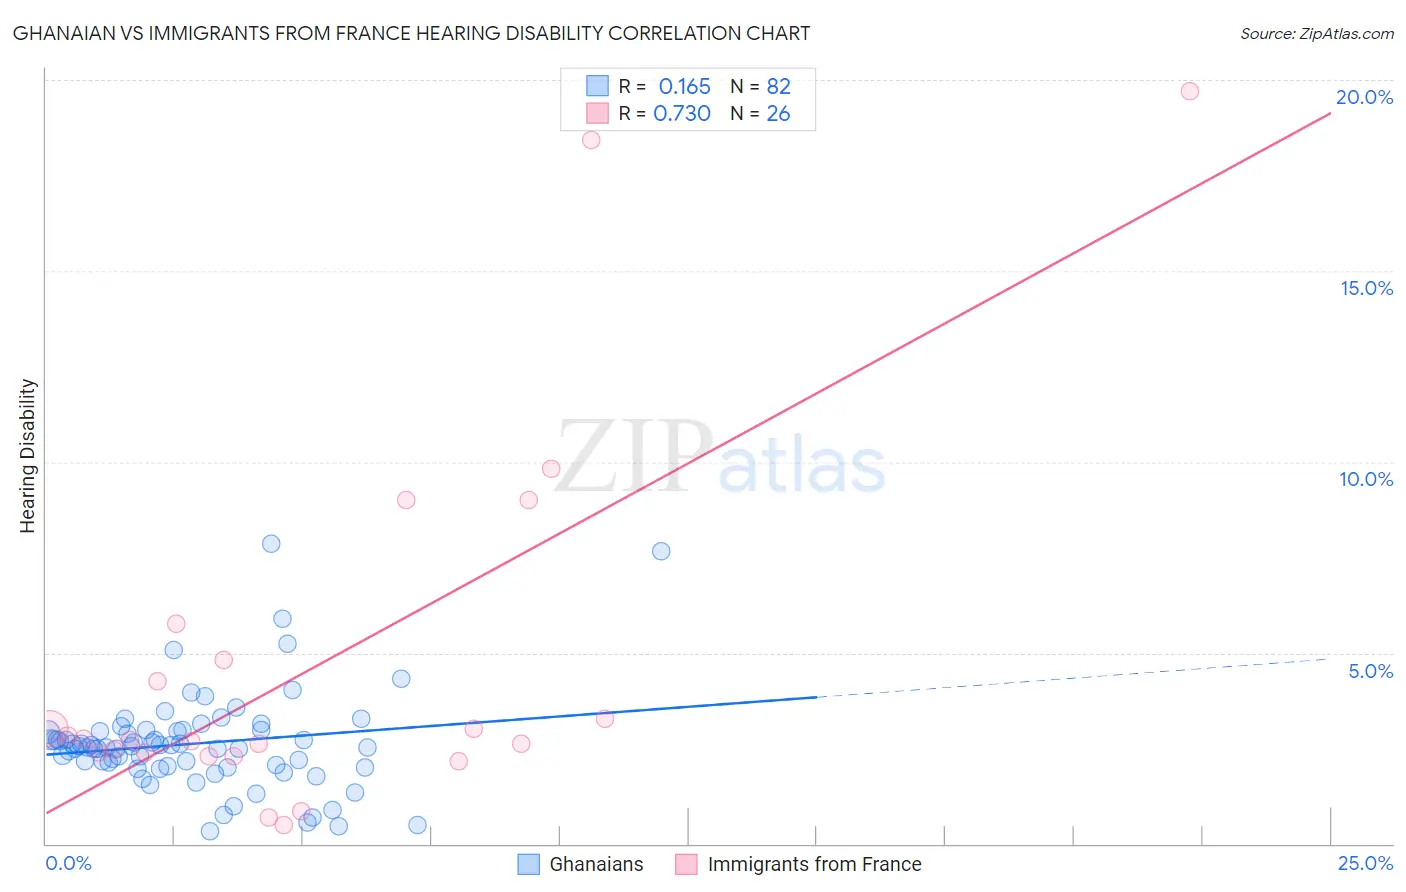
Ghanaian vs Immigrants from France Hearing Disability Correlation Chart
The statistical analysis conducted on geographies consisting of 190,612,767 people shows a poor positive correlation between the proportion of Ghanaians and percentage of population with hearing disability in the United States with a correlation coefficient (R) of 0.165 and weighted average of 2.5%. Similarly, the statistical analysis conducted on geographies consisting of 287,858,802 people shows a strong positive correlation between the proportion of Immigrants from France and percentage of population with hearing disability in the United States with a correlation coefficient (R) of 0.730 and weighted average of 2.9%, a difference of 14.7%.
Hearing Disability Correlation Summary
| Measurement | Ghanaian | Immigrants from France |
| Minimum | 0.32% | 0.48% |
| Maximum | 7.9% | 19.7% |
| Range | 7.5% | 19.2% |
| Mean | 2.6% | 4.7% |
| Median | 2.5% | 2.7% |
| Interquartile 25% (IQ1) | 2.0% | 2.4% |
| Interquartile 75% (IQ3) | 3.0% | 4.8% |
| Interquartile Range (IQR) | 0.92% | 2.4% |
| Standard Deviation (Sample) | 1.3% | 4.9% |
| Standard Deviation (Population) | 1.3% | 4.8% |
Similar Demographics by Hearing Disability
Demographics Similar to Ghanaians by Hearing Disability
In terms of hearing disability, the demographic groups most similar to Ghanaians are Immigrants from Sierra Leone (2.6%, a difference of 0.040%), Immigrants from Bolivia (2.5%, a difference of 0.070%), Thai (2.5%, a difference of 0.11%), Dominican (2.5%, a difference of 0.14%), and Immigrants from Nigeria (2.6%, a difference of 0.54%).
| Demographics | Rating | Rank | Hearing Disability |
| Ecuadorians | 99.9 /100 | #14 | Exceptional 2.5% |
| Barbadians | 99.9 /100 | #15 | Exceptional 2.5% |
| Immigrants | West Indies | 99.9 /100 | #16 | Exceptional 2.5% |
| Immigrants | India | 99.9 /100 | #17 | Exceptional 2.5% |
| Dominicans | 99.8 /100 | #18 | Exceptional 2.5% |
| Thais | 99.8 /100 | #19 | Exceptional 2.5% |
| Immigrants | Bolivia | 99.8 /100 | #20 | Exceptional 2.5% |
| Ghanaians | 99.8 /100 | #21 | Exceptional 2.5% |
| Immigrants | Sierra Leone | 99.8 /100 | #22 | Exceptional 2.6% |
| Immigrants | Nigeria | 99.8 /100 | #23 | Exceptional 2.6% |
| Immigrants | Ghana | 99.8 /100 | #24 | Exceptional 2.6% |
| Immigrants | El Salvador | 99.7 /100 | #25 | Exceptional 2.6% |
| Immigrants | Senegal | 99.7 /100 | #26 | Exceptional 2.6% |
| Immigrants | South Central Asia | 99.7 /100 | #27 | Exceptional 2.6% |
| Immigrants | Haiti | 99.7 /100 | #28 | Exceptional 2.6% |
Demographics Similar to Immigrants from France by Hearing Disability
In terms of hearing disability, the demographic groups most similar to Immigrants from France are Immigrants from Lithuania (2.9%, a difference of 0.010%), Palestinian (2.9%, a difference of 0.060%), Sudanese (2.9%, a difference of 0.12%), Immigrants from Lebanon (2.9%, a difference of 0.19%), and Costa Rican (2.9%, a difference of 0.21%).
| Demographics | Rating | Rank | Hearing Disability |
| Immigrants | Bulgaria | 79.2 /100 | #144 | Good 2.9% |
| Immigrants | Congo | 78.9 /100 | #145 | Good 2.9% |
| Brazilians | 78.7 /100 | #146 | Good 2.9% |
| Tongans | 78.6 /100 | #147 | Good 2.9% |
| Immigrants | Russia | 77.7 /100 | #148 | Good 2.9% |
| Immigrants | Panama | 76.9 /100 | #149 | Good 2.9% |
| Palestinians | 73.6 /100 | #150 | Good 2.9% |
| Immigrants | France | 73.1 /100 | #151 | Good 2.9% |
| Immigrants | Lithuania | 73.0 /100 | #152 | Good 2.9% |
| Sudanese | 72.1 /100 | #153 | Good 2.9% |
| Immigrants | Lebanon | 71.5 /100 | #154 | Good 2.9% |
| Costa Ricans | 71.4 /100 | #155 | Good 2.9% |
| Immigrants | Poland | 70.2 /100 | #156 | Good 2.9% |
| Immigrants | Kazakhstan | 69.6 /100 | #157 | Good 2.9% |
| Immigrants | Burma/Myanmar | 69.5 /100 | #158 | Good 2.9% |