Ghanaian vs Immigrants from Ethiopia Disability Age 65 to 74
COMPARE
Ghanaian
Immigrants from Ethiopia
Disability Age 65 to 74
Disability Age 65 to 74 Comparison
Ghanaians
Immigrants from Ethiopia
24.1%
DISABILITY AGE 65 TO 74
10.4/ 100
METRIC RATING
220th/ 347
METRIC RANK
22.7%
DISABILITY AGE 65 TO 74
85.3/ 100
METRIC RATING
142nd/ 347
METRIC RANK
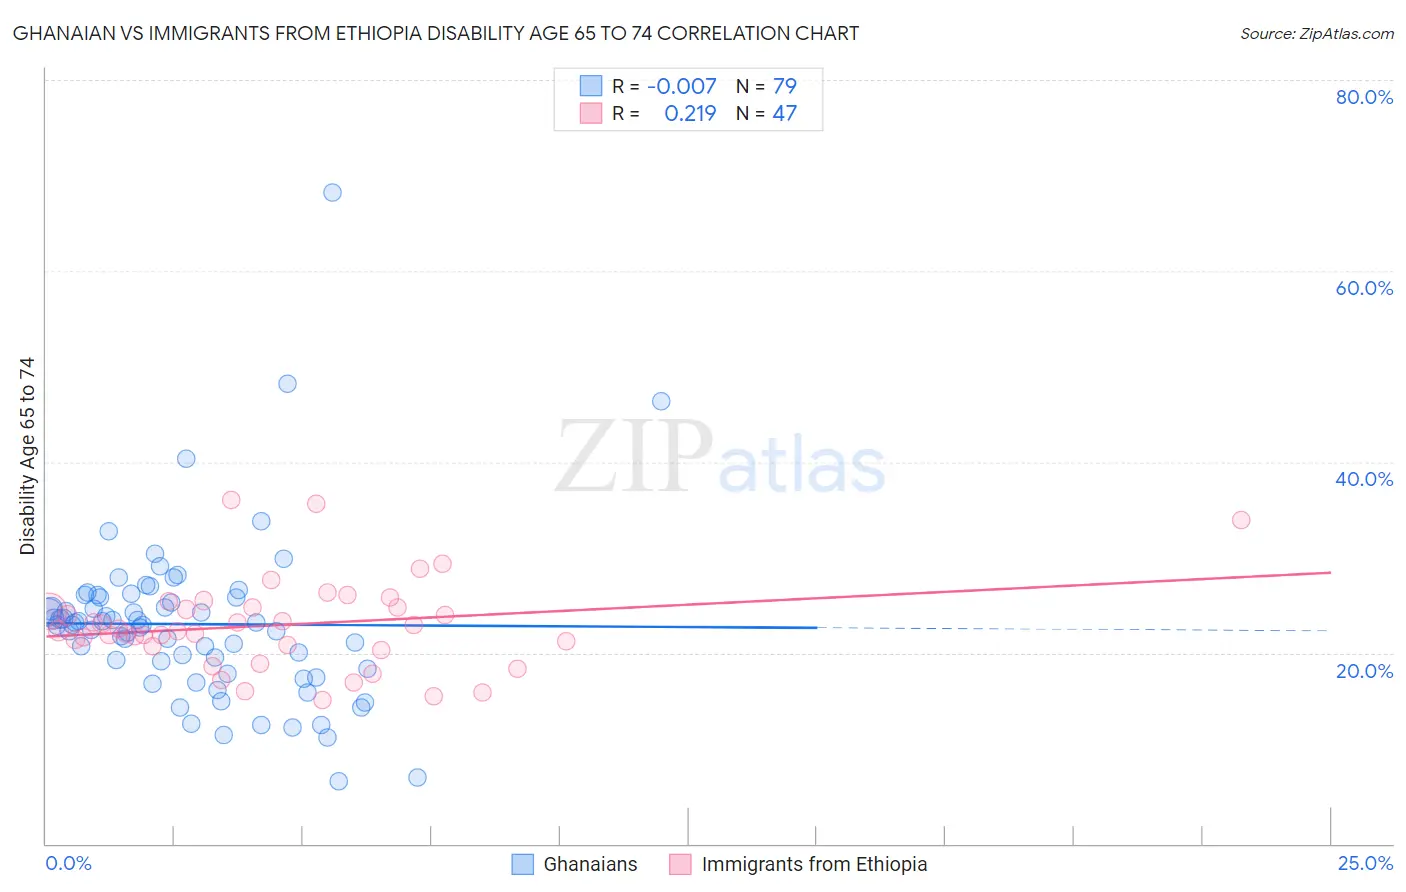
Ghanaian vs Immigrants from Ethiopia Disability Age 65 to 74 Correlation Chart
The statistical analysis conducted on geographies consisting of 190,307,829 people shows no correlation between the proportion of Ghanaians and percentage of population with a disability between the ages 65 and 75 in the United States with a correlation coefficient (R) of -0.007 and weighted average of 24.1%. Similarly, the statistical analysis conducted on geographies consisting of 211,341,369 people shows a weak positive correlation between the proportion of Immigrants from Ethiopia and percentage of population with a disability between the ages 65 and 75 in the United States with a correlation coefficient (R) of 0.219 and weighted average of 22.7%, a difference of 5.9%.
Disability Age 65 to 74 Correlation Summary
| Measurement | Ghanaian | Immigrants from Ethiopia |
| Minimum | 6.5% | 15.1% |
| Maximum | 68.3% | 35.9% |
| Range | 61.8% | 20.9% |
| Mean | 23.0% | 22.9% |
| Median | 22.9% | 22.3% |
| Interquartile 25% (IQ1) | 18.3% | 20.7% |
| Interquartile 75% (IQ3) | 25.9% | 24.7% |
| Interquartile Range (IQR) | 7.5% | 4.0% |
| Standard Deviation (Sample) | 8.8% | 4.7% |
| Standard Deviation (Population) | 8.7% | 4.6% |
Similar Demographics by Disability Age 65 to 74
Demographics Similar to Ghanaians by Disability Age 65 to 74
In terms of disability age 65 to 74, the demographic groups most similar to Ghanaians are Immigrants from Nicaragua (24.1%, a difference of 0.090%), Native Hawaiian (24.1%, a difference of 0.16%), Immigrants from Burma/Myanmar (24.0%, a difference of 0.18%), Immigrants from Portugal (24.0%, a difference of 0.19%), and Immigrants from Nigeria (24.0%, a difference of 0.19%).
| Demographics | Rating | Rank | Disability Age 65 to 74 |
| Nicaraguans | 14.3 /100 | #213 | Poor 23.9% |
| Immigrants | Oceania | 13.6 /100 | #214 | Poor 24.0% |
| Pennsylvania Germans | 13.3 /100 | #215 | Poor 24.0% |
| Jamaicans | 12.2 /100 | #216 | Poor 24.0% |
| Immigrants | Portugal | 11.7 /100 | #217 | Poor 24.0% |
| Immigrants | Nigeria | 11.7 /100 | #218 | Poor 24.0% |
| Immigrants | Burma/Myanmar | 11.6 /100 | #219 | Poor 24.0% |
| Ghanaians | 10.4 /100 | #220 | Poor 24.1% |
| Immigrants | Nicaragua | 9.8 /100 | #221 | Tragic 24.1% |
| Native Hawaiians | 9.3 /100 | #222 | Tragic 24.1% |
| Immigrants | Middle Africa | 8.9 /100 | #223 | Tragic 24.1% |
| Immigrants | Panama | 8.6 /100 | #224 | Tragic 24.1% |
| Bermudans | 8.2 /100 | #225 | Tragic 24.2% |
| Iraqis | 8.1 /100 | #226 | Tragic 24.2% |
| Nigerians | 7.8 /100 | #227 | Tragic 24.2% |
Demographics Similar to Immigrants from Ethiopia by Disability Age 65 to 74
In terms of disability age 65 to 74, the demographic groups most similar to Immigrants from Ethiopia are Belgian (22.7%, a difference of 0.010%), Ugandan (22.7%, a difference of 0.020%), Immigrants from Syria (22.7%, a difference of 0.060%), Arab (22.8%, a difference of 0.060%), and Danish (22.8%, a difference of 0.11%).
| Demographics | Rating | Rank | Disability Age 65 to 74 |
| Immigrants | Ukraine | 88.4 /100 | #135 | Excellent 22.6% |
| Ethiopians | 87.9 /100 | #136 | Excellent 22.7% |
| Taiwanese | 87.6 /100 | #137 | Excellent 22.7% |
| Immigrants | Moldova | 87.3 /100 | #138 | Excellent 22.7% |
| Immigrants | Syria | 85.8 /100 | #139 | Excellent 22.7% |
| Ugandans | 85.4 /100 | #140 | Excellent 22.7% |
| Belgians | 85.3 /100 | #141 | Excellent 22.7% |
| Immigrants | Ethiopia | 85.3 /100 | #142 | Excellent 22.7% |
| Arabs | 84.8 /100 | #143 | Excellent 22.8% |
| Danes | 84.4 /100 | #144 | Excellent 22.8% |
| Immigrants | Uganda | 84.0 /100 | #145 | Excellent 22.8% |
| Alsatians | 83.7 /100 | #146 | Excellent 22.8% |
| Immigrants | Uzbekistan | 83.1 /100 | #147 | Excellent 22.8% |
| New Zealanders | 79.9 /100 | #148 | Good 22.9% |
| Swiss | 79.7 /100 | #149 | Good 22.9% |