Korean vs Immigrants from Ethiopia Disability Age 65 to 74
COMPARE
Korean
Immigrants from Ethiopia
Disability Age 65 to 74
Disability Age 65 to 74 Comparison
Koreans
Immigrants from Ethiopia
23.1%
DISABILITY AGE 65 TO 74
64.2/ 100
METRIC RATING
160th/ 347
METRIC RANK
22.7%
DISABILITY AGE 65 TO 74
85.3/ 100
METRIC RATING
142nd/ 347
METRIC RANK
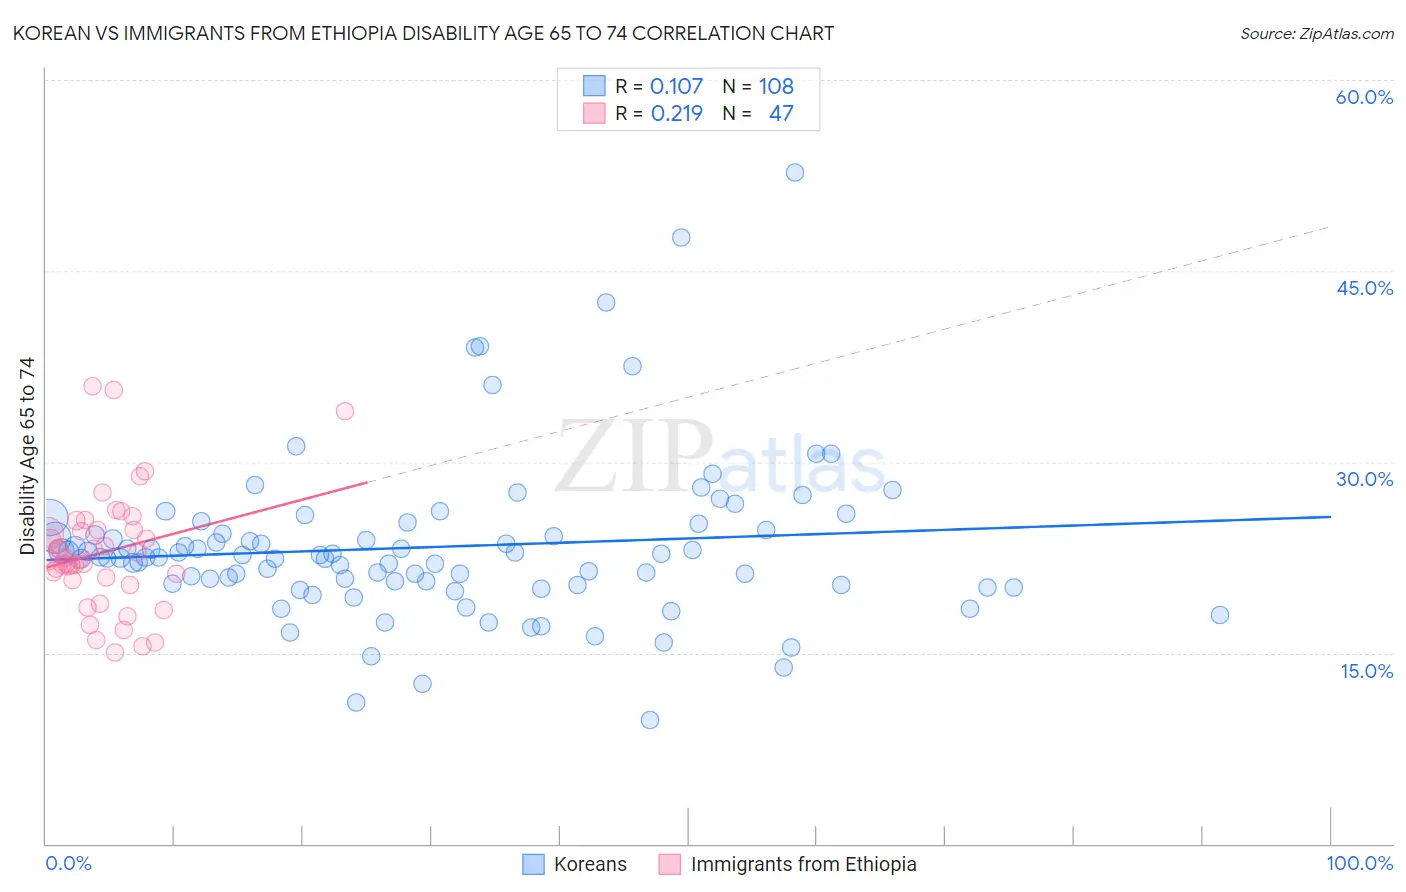
Korean vs Immigrants from Ethiopia Disability Age 65 to 74 Correlation Chart
The statistical analysis conducted on geographies consisting of 509,278,408 people shows a poor positive correlation between the proportion of Koreans and percentage of population with a disability between the ages 65 and 75 in the United States with a correlation coefficient (R) of 0.107 and weighted average of 23.1%. Similarly, the statistical analysis conducted on geographies consisting of 211,341,369 people shows a weak positive correlation between the proportion of Immigrants from Ethiopia and percentage of population with a disability between the ages 65 and 75 in the United States with a correlation coefficient (R) of 0.219 and weighted average of 22.7%, a difference of 1.8%.
Disability Age 65 to 74 Correlation Summary
| Measurement | Korean | Immigrants from Ethiopia |
| Minimum | 9.7% | 15.1% |
| Maximum | 52.7% | 35.9% |
| Range | 43.0% | 20.9% |
| Mean | 23.3% | 22.9% |
| Median | 22.5% | 22.3% |
| Interquartile 25% (IQ1) | 20.4% | 20.7% |
| Interquartile 75% (IQ3) | 24.5% | 24.7% |
| Interquartile Range (IQR) | 4.1% | 4.0% |
| Standard Deviation (Sample) | 6.4% | 4.7% |
| Standard Deviation (Population) | 6.4% | 4.6% |
Demographics Similar to Koreans and Immigrants from Ethiopia by Disability Age 65 to 74
In terms of disability age 65 to 74, the demographic groups most similar to Koreans are Immigrants from Cameroon (23.1%, a difference of 0.030%), South American Indian (23.1%, a difference of 0.090%), Immigrants from Vietnam (23.1%, a difference of 0.33%), Czechoslovakian (23.0%, a difference of 0.56%), and Immigrants from Western Asia (23.0%, a difference of 0.67%). Similarly, the demographic groups most similar to Immigrants from Ethiopia are Belgian (22.7%, a difference of 0.010%), Arab (22.8%, a difference of 0.060%), Danish (22.8%, a difference of 0.11%), Immigrants from Uganda (22.8%, a difference of 0.15%), and Alsatian (22.8%, a difference of 0.18%).
| Demographics | Rating | Rank | Disability Age 65 to 74 |
| Belgians | 85.3 /100 | #141 | Excellent 22.7% |
| Immigrants | Ethiopia | 85.3 /100 | #142 | Excellent 22.7% |
| Arabs | 84.8 /100 | #143 | Excellent 22.8% |
| Danes | 84.4 /100 | #144 | Excellent 22.8% |
| Immigrants | Uganda | 84.0 /100 | #145 | Excellent 22.8% |
| Alsatians | 83.7 /100 | #146 | Excellent 22.8% |
| Immigrants | Uzbekistan | 83.1 /100 | #147 | Excellent 22.8% |
| New Zealanders | 79.9 /100 | #148 | Good 22.9% |
| Swiss | 79.7 /100 | #149 | Good 22.9% |
| Canadians | 77.7 /100 | #150 | Good 22.9% |
| Immigrants | Morocco | 77.6 /100 | #151 | Good 22.9% |
| Finns | 76.5 /100 | #152 | Good 22.9% |
| Slavs | 75.2 /100 | #153 | Good 23.0% |
| Sri Lankans | 74.0 /100 | #154 | Good 23.0% |
| British | 73.9 /100 | #155 | Good 23.0% |
| Immigrants | Western Asia | 73.8 /100 | #156 | Good 23.0% |
| Czechoslovakians | 72.4 /100 | #157 | Good 23.0% |
| Immigrants | Vietnam | 69.1 /100 | #158 | Good 23.1% |
| South American Indians | 65.5 /100 | #159 | Good 23.1% |
| Koreans | 64.2 /100 | #160 | Good 23.1% |
| Immigrants | Cameroon | 63.8 /100 | #161 | Good 23.1% |