Ghanaian vs Immigrants from Ethiopia Disability Age 35 to 64
COMPARE
Ghanaian
Immigrants from Ethiopia
Disability Age 35 to 64
Disability Age 35 to 64 Comparison
Ghanaians
Immigrants from Ethiopia
11.7%
DISABILITY AGE 35 TO 64
14.8/ 100
METRIC RATING
207th/ 347
METRIC RANK
10.5%
DISABILITY AGE 35 TO 64
97.2/ 100
METRIC RATING
109th/ 347
METRIC RANK
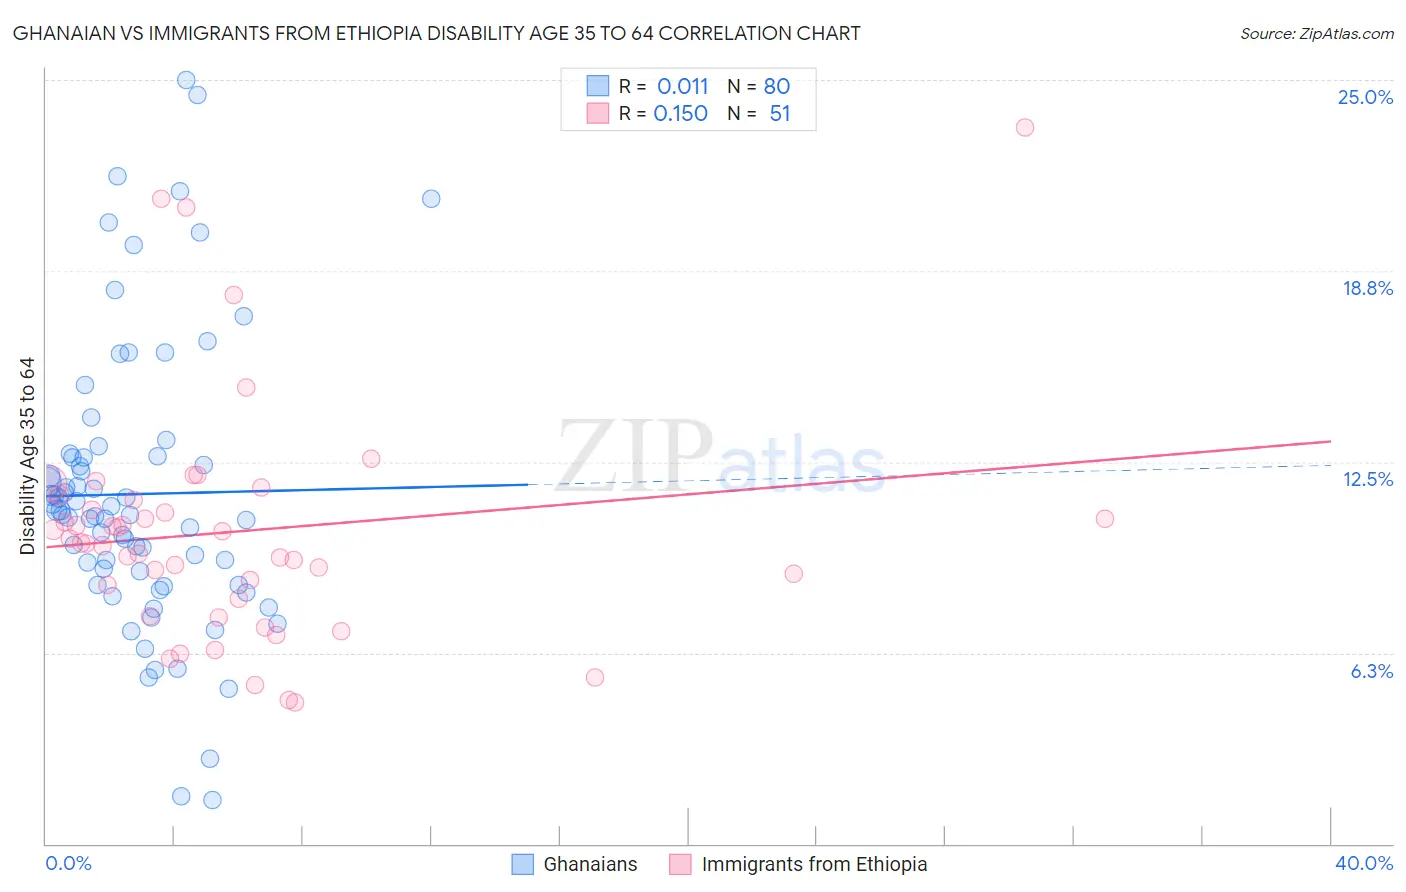
Ghanaian vs Immigrants from Ethiopia Disability Age 35 to 64 Correlation Chart
The statistical analysis conducted on geographies consisting of 190,523,833 people shows no correlation between the proportion of Ghanaians and percentage of population with a disability between the ages 34 and 64 in the United States with a correlation coefficient (R) of 0.011 and weighted average of 11.7%. Similarly, the statistical analysis conducted on geographies consisting of 211,448,836 people shows a poor positive correlation between the proportion of Immigrants from Ethiopia and percentage of population with a disability between the ages 34 and 64 in the United States with a correlation coefficient (R) of 0.150 and weighted average of 10.5%, a difference of 11.5%.
Disability Age 35 to 64 Correlation Summary
| Measurement | Ghanaian | Immigrants from Ethiopia |
| Minimum | 1.4% | 4.6% |
| Maximum | 25.0% | 23.4% |
| Range | 23.6% | 18.8% |
| Mean | 11.4% | 10.2% |
| Median | 10.8% | 9.9% |
| Interquartile 25% (IQ1) | 8.7% | 8.0% |
| Interquartile 75% (IQ3) | 12.7% | 11.2% |
| Interquartile Range (IQR) | 4.0% | 3.2% |
| Standard Deviation (Sample) | 4.7% | 3.8% |
| Standard Deviation (Population) | 4.6% | 3.8% |
Similar Demographics by Disability Age 35 to 64
Demographics Similar to Ghanaians by Disability Age 35 to 64
In terms of disability age 35 to 64, the demographic groups most similar to Ghanaians are Native Hawaiian (11.7%, a difference of 0.0%), Guatemalan (11.7%, a difference of 0.030%), Slavic (11.7%, a difference of 0.10%), Nigerian (11.6%, a difference of 0.22%), and European (11.7%, a difference of 0.22%).
| Demographics | Rating | Rank | Disability Age 35 to 64 |
| Swiss | 18.7 /100 | #200 | Poor 11.6% |
| Immigrants | Kenya | 17.7 /100 | #201 | Poor 11.6% |
| Immigrants | Guatemala | 17.5 /100 | #202 | Poor 11.6% |
| British | 17.0 /100 | #203 | Poor 11.6% |
| Nigerians | 16.3 /100 | #204 | Poor 11.6% |
| Slavs | 15.5 /100 | #205 | Poor 11.7% |
| Native Hawaiians | 14.8 /100 | #206 | Poor 11.7% |
| Ghanaians | 14.8 /100 | #207 | Poor 11.7% |
| Guatemalans | 14.6 /100 | #208 | Poor 11.7% |
| Europeans | 13.5 /100 | #209 | Poor 11.7% |
| Belgians | 13.1 /100 | #210 | Poor 11.7% |
| Canadians | 13.0 /100 | #211 | Poor 11.7% |
| Immigrants | Jamaica | 11.8 /100 | #212 | Poor 11.7% |
| Yugoslavians | 11.6 /100 | #213 | Poor 11.7% |
| Immigrants | Sudan | 11.4 /100 | #214 | Poor 11.7% |
Demographics Similar to Immigrants from Ethiopia by Disability Age 35 to 64
In terms of disability age 35 to 64, the demographic groups most similar to Immigrants from Ethiopia are Korean (10.5%, a difference of 0.060%), Ethiopian (10.5%, a difference of 0.14%), Zimbabwean (10.4%, a difference of 0.15%), Brazilian (10.5%, a difference of 0.27%), and Assyrian/Chaldean/Syriac (10.5%, a difference of 0.30%).
| Demographics | Rating | Rank | Disability Age 35 to 64 |
| Immigrants | Western Asia | 98.0 /100 | #102 | Exceptional 10.4% |
| Immigrants | Ukraine | 97.9 /100 | #103 | Exceptional 10.4% |
| Immigrants | Austria | 97.8 /100 | #104 | Exceptional 10.4% |
| Macedonians | 97.8 /100 | #105 | Exceptional 10.4% |
| Immigrants | Hungary | 97.6 /100 | #106 | Exceptional 10.4% |
| Zimbabweans | 97.4 /100 | #107 | Exceptional 10.4% |
| Ethiopians | 97.4 /100 | #108 | Exceptional 10.5% |
| Immigrants | Ethiopia | 97.2 /100 | #109 | Exceptional 10.5% |
| Koreans | 97.1 /100 | #110 | Exceptional 10.5% |
| Brazilians | 96.9 /100 | #111 | Exceptional 10.5% |
| Assyrians/Chaldeans/Syriacs | 96.8 /100 | #112 | Exceptional 10.5% |
| Tongans | 96.6 /100 | #113 | Exceptional 10.5% |
| Immigrants | Morocco | 96.6 /100 | #114 | Exceptional 10.5% |
| Immigrants | Netherlands | 96.3 /100 | #115 | Exceptional 10.5% |
| Immigrants | Nepal | 95.9 /100 | #116 | Exceptional 10.6% |