Ghanaian vs Immigrants from Ethiopia Unemployment Among Ages 45 to 54 years

COMPARE

Ghanaian
Race
Ancestry
AfghanAfricanAlaska NativeAlaskan AthabascanAlbanianAleutAlsatianAmericanApacheArabArapahoArgentineanArmenianAssyrian/Chaldean/SyriacAustralianAustrianBahamianBangladeshiBarbadianBasqueBelgianBelizeanBermudanBhutaneseBlackfeetBolivianBrazilianBritishBritish West IndianBulgarianBurmeseCajunCambodianCanadianCape VerdeanCarpatho RusynCelticCentral AmericanCentral American IndianCherokeeCheyenneChickasawChileanChineseChippewaChoctawColombianColvilleComancheCosta RicanCreeCreekCroatianCrowCubanCypriotCzechCzechoslovakianDanishDelawareDominicanDutchDutch West IndianEastern EuropeanEcuadorianEgyptianEnglishEstonianEthiopianEuropeanFijianFilipinoFinnishFrenchFrench American IndianFrench CanadianGermanGerman RussianGhanaianGreekGuamanian/ChamorroGuatemalanGuyaneseHaitianHmongHonduranHopiHoumaHungarianIcelanderIndian (Asian)IndonesianInupiatIranianIraqiIrishIroquoisIsraeliItalianJamaicanJapaneseJordanianKenyanKiowaKoreanLaotianLatvianLebaneseLiberianLithuanianLumbeeLuxembourgerMacedonianMalaysianMalteseMarshalleseMenomineeMexicanMexican American IndianMongolianMoroccanNative HawaiianNavajoNepaleseNew ZealanderNicaraguanNigerianNorthern EuropeanNorwegianOkinawanOsageOttawaPaiutePakistaniPalestinianPanamanianParaguayanPennsylvania GermanPeruvianPimaPolishPortuguesePotawatomiPuebloPuerto RicanPuget Sound SalishRomanianRussianSalvadoranSamoanScandinavianScotch-IrishScottishSeminoleSenegaleseSerbianShoshoneSierra LeoneanSiouxSlavicSlovakSloveneSomaliSouth AfricanSouth AmericanSouth American IndianSoviet UnionSpaniardSpanishSpanish AmericanSpanish American IndianSri LankanSubsaharan AfricanSudaneseSwedishSwissSyrianTaiwaneseThaiTlingit-HaidaTohono O'OdhamTonganTrinidadian and TobagonianTsimshianTurkishU.S. Virgin IslanderUgandanUkrainianUruguayanUteVenezuelanVietnameseWelshWest IndianYakamaYaquiYugoslavianYumanYup'ikZimbabwean
Immigration
NonimmigrantsImmigrantsAfghanistanAfricaAlbaniaArgentinaArmeniaAsiaAustraliaAustriaBahamasBangladeshBarbadosBelarusBelgiumBelizeBoliviaBosnia and HerzegovinaBrazilBulgariaBurma/MyanmarCabo VerdeCambodiaCameroonCanadaCaribbeanCentral AmericaChileChinaColombiaCongoCosta RicaCroatiaCubaCzechoslovakiaDenmarkDominicaDominican RepublicEastern AfricaEastern AsiaEastern EuropeEcuadorEgyptEl SalvadorEnglandEritreaEuropeFijiFranceGermanyGhanaGreeceGrenadaGuatemalaGuyanaHaitiHondurasHong KongHungaryIndiaIndonesiaIranIraqIrelandIsraelItalyJamaicaJapanJordanKazakhstanKenyaKoreaKuwaitLaosLatin AmericaLatviaLebanonLiberiaLithuaniaMalaysiaMexicoMicronesiaMiddle AfricaMoldovaMoroccoNepalNetherlandsNicaraguaNigeriaNorth AmericaNorth MacedoniaNorthern AfricaNorthern EuropeNorwayOceaniaPakistanPanamaPeruPhilippinesPolandPortugalRomaniaRussiaSaudi ArabiaScotlandSenegalSerbiaSierra LeoneSingaporeSomaliaSouth AfricaSouth AmericaSouth Central AsiaSouth Eastern AsiaSouthern EuropeSpainSri LankaSt. Vincent and the GrenadinesSudanSwedenSwitzerlandSyriaTaiwanThailandTrinidad and TobagoTurkeyUgandaUkraineUruguayUzbekistanVenezuelaVietnamWest IndiesWestern AfricaWestern AsiaWestern EuropeYemenZaireZimbabweAzores
Immigrants from Ethiopia
Race
Ancestry
AfghanAfricanAlaska NativeAlaskan AthabascanAlbanianAleutAlsatianAmericanApacheArabArapahoArgentineanArmenianAssyrian/Chaldean/SyriacAustralianAustrianBahamianBangladeshiBarbadianBasqueBelgianBelizeanBermudanBhutaneseBlackfeetBolivianBrazilianBritishBritish West IndianBulgarianBurmeseCajunCambodianCanadianCape VerdeanCarpatho RusynCelticCentral AmericanCentral American IndianCherokeeCheyenneChickasawChileanChineseChippewaChoctawColombianColvilleComancheCosta RicanCreeCreekCroatianCrowCubanCypriotCzechCzechoslovakianDanishDelawareDominicanDutchDutch West IndianEastern EuropeanEcuadorianEgyptianEnglishEstonianEthiopianEuropeanFijianFilipinoFinnishFrenchFrench American IndianFrench CanadianGermanGerman RussianGreekGuamanian/ChamorroGuatemalanGuyaneseHaitianHmongHonduranHopiHoumaHungarianIcelanderIndian (Asian)IndonesianInupiatIranianIraqiIrishIroquoisIsraeliItalianJamaicanJapaneseJordanianKenyanKiowaKoreanLaotianLatvianLebaneseLiberianLithuanianLumbeeLuxembourgerMacedonianMalaysianMalteseMarshalleseMenomineeMexicanMexican American IndianMongolianMoroccanNative HawaiianNavajoNepaleseNew ZealanderNicaraguanNigerianNorthern EuropeanNorwegianOkinawanOsageOttawaPaiutePakistaniPalestinianPanamanianParaguayanPennsylvania GermanPeruvianPimaPolishPortuguesePotawatomiPuebloPuerto RicanPuget Sound SalishRomanianRussianSalvadoranSamoanScandinavianScotch-IrishScottishSeminoleSenegaleseSerbianShoshoneSierra LeoneanSiouxSlavicSlovakSloveneSomaliSouth AfricanSouth AmericanSouth American IndianSoviet UnionSpaniardSpanishSpanish AmericanSpanish American IndianSri LankanSubsaharan AfricanSudaneseSwedishSwissSyrianTaiwaneseThaiTlingit-HaidaTohono O'OdhamTonganTrinidadian and TobagonianTsimshianTurkishU.S. Virgin IslanderUgandanUkrainianUruguayanUteVenezuelanVietnameseWelshWest IndianYakamaYaquiYugoslavianYumanYup'ikZimbabwean
Immigration
NonimmigrantsImmigrantsAfghanistanAfricaAlbaniaArgentinaArmeniaAsiaAustraliaAustriaBahamasBangladeshBarbadosBelarusBelgiumBelizeBoliviaBosnia and HerzegovinaBrazilBulgariaBurma/MyanmarCabo VerdeCambodiaCameroonCanadaCaribbeanCentral AmericaChileChinaColombiaCongoCosta RicaCroatiaCubaCzechoslovakiaDenmarkDominicaDominican RepublicEastern AfricaEastern AsiaEastern EuropeEcuadorEgyptEl SalvadorEnglandEritreaEthiopiaEuropeFijiFranceGermanyGhanaGreeceGrenadaGuatemalaGuyanaHaitiHondurasHong KongHungaryIndiaIndonesiaIranIraqIrelandIsraelItalyJamaicaJapanJordanKazakhstanKenyaKoreaKuwaitLaosLatin AmericaLatviaLebanonLiberiaLithuaniaMalaysiaMexicoMicronesiaMiddle AfricaMoldovaMoroccoNepalNetherlandsNicaraguaNigeriaNorth AmericaNorth MacedoniaNorthern AfricaNorthern EuropeNorwayOceaniaPakistanPanamaPeruPhilippinesPolandPortugalRomaniaRussiaSaudi ArabiaScotlandSenegalSerbiaSierra LeoneSingaporeSomaliaSouth AfricaSouth AmericaSouth Central AsiaSouth Eastern AsiaSouthern EuropeSpainSri LankaSt. Vincent and the GrenadinesSudanSwedenSwitzerlandSyriaTaiwanThailandTrinidad and TobagoTurkeyUgandaUkraineUruguayUzbekistanVenezuelaVietnamWest IndiesWestern AfricaWestern AsiaWestern EuropeYemenZaireZimbabweAzores
Unemployment Among Ages 45 to 54 years
Income
Poverty
Unemployment
Labor Participation
Family Structure
Vehicle Availability
Education Level
Disability

Unemployment Among Ages 45 to 54 years Comparison

Ghanaians

Immigrants from Ethiopia

Tragic
Exceptional
4.9%
UNEMPLOYMENT AMONG AGES 45 TO 54 YEARS
0.0/ 100
METRIC RATING
266th/ 347
METRIC RANK
4.4%
UNEMPLOYMENT AMONG AGES 45 TO 54 YEARS
96.1/ 100
METRIC RATING
95th/ 347
METRIC RANK

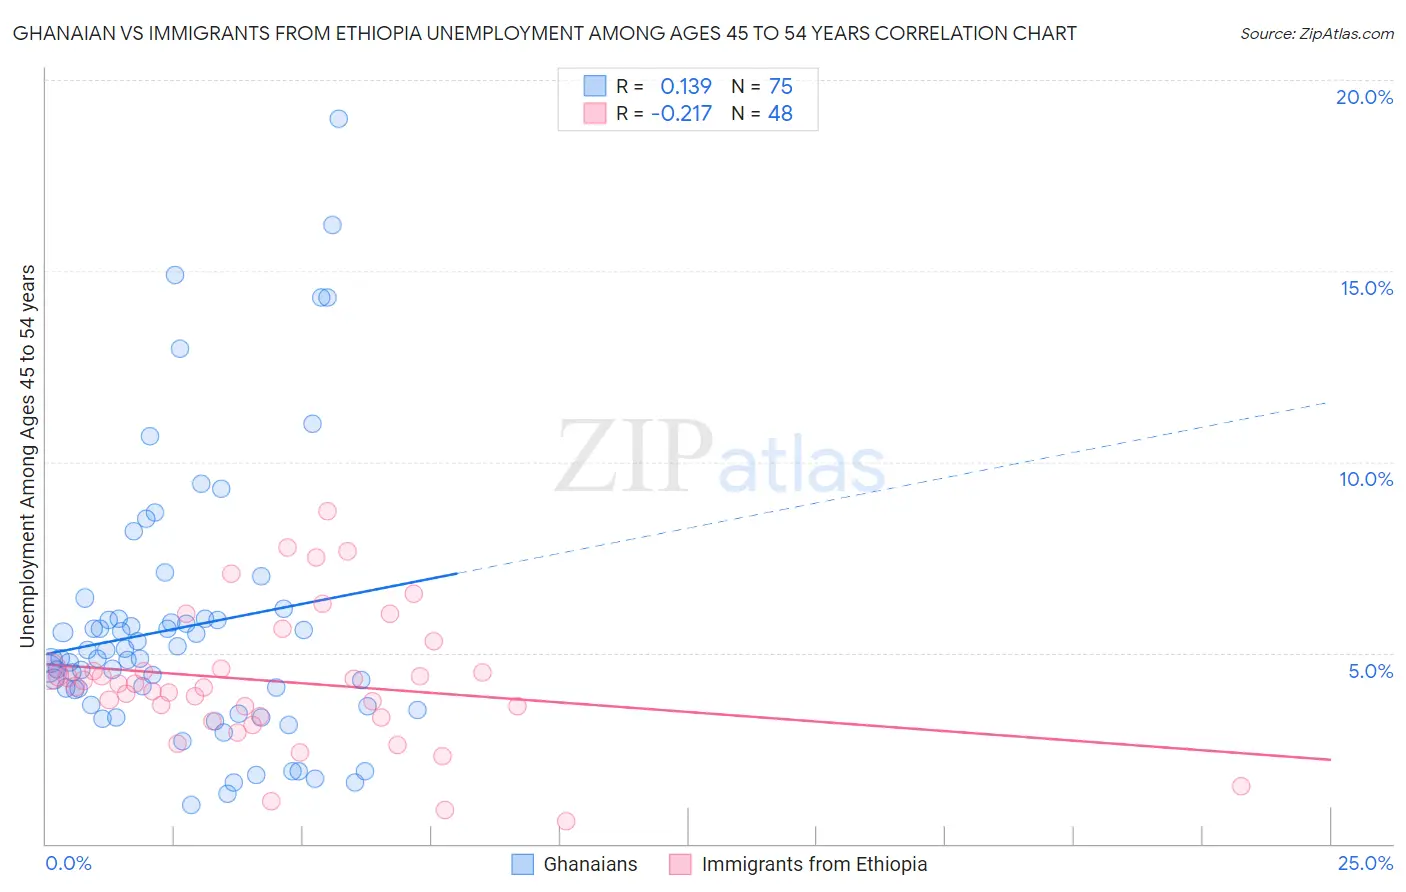
Ghanaian vs Immigrants from Ethiopia Unemployment Among Ages 45 to 54 years Correlation Chart

The statistical analysis conducted on geographies consisting of 188,481,506 people shows a poor positive correlation between the proportion of Ghanaians and unemployment rate among population between the ages 45 and 54 in the United States with a correlation coefficient (R) of 0.139 and weighted average of 4.9%. Similarly, the statistical analysis conducted on geographies consisting of 209,092,929 people shows a weak negative correlation between the proportion of Immigrants from Ethiopia and unemployment rate among population between the ages 45 and 54 in the United States with a correlation coefficient (R) of -0.217 and weighted average of 4.4%, a difference of 13.2%.
Ghanaian vs Immigrants from Ethiopia Unemployment Among Ages 45 to 54 years

Unemployment Among Ages 45 to 54 years Correlation Summary

MeasurementGhanaianImmigrants from Ethiopia
Minimum1.0%0.60%
Maximum19.0%8.7%
Range18.0%8.1%
Mean5.7%4.2%
Median4.8%4.2%
Interquartile 25% (IQ1)3.6%3.3%
Interquartile 75% (IQ3)5.9%4.6%
Interquartile Range (IQR)2.3%1.2%
Standard Deviation (Sample)3.5%1.8%
Standard Deviation (Population)3.5%1.7%

Similar Demographics by Unemployment Among Ages 45 to 54 years

Demographics Similar to Ghanaians by Unemployment Among Ages 45 to 54 years

In terms of unemployment among ages 45 to 54 years, the demographic groups most similar to Ghanaians are Bahamian (4.9%, a difference of 0.090%), Immigrants from Somalia (4.9%, a difference of 0.12%), Immigrants from Uzbekistan (4.9%, a difference of 0.18%), Immigrants from Guatemala (4.9%, a difference of 0.39%), and Somali (5.0%, a difference of 0.56%).
DemographicsRating | RankUnemployment Among Ages 45 to 54 years
Ugandans
0.1
/100
|
#259
Tragic
4.9%
Mexican American Indians
0.1
/100
|
#260
Tragic
4.9%
Guatemalans
0.1
/100
|
#261
Tragic
4.9%
Mexicans
0.1
/100
|
#262
Tragic
4.9%
Immigrants | Fiji
0.1
/100
|
#263
Tragic
4.9%
Immigrants | Guatemala
0.1
/100
|
#264
Tragic
4.9%
Immigrants | Somalia
0.1
/100
|
#265
Tragic
4.9%
Ghanaians
0.0
/100
|
#266
Tragic
4.9%
Bahamians
0.0
/100
|
#267
Tragic
4.9%
Immigrants | Uzbekistan
0.0
/100
|
#268
Tragic
4.9%
Somalis
0.0
/100
|
#269
Tragic
5.0%
Immigrants | Ghana
0.0
/100
|
#270
Tragic
5.0%
Cajuns
0.0
/100
|
#271
Tragic
5.0%
Immigrants | Central America
0.0
/100
|
#272
Tragic
5.0%
Immigrants | Latin America
0.0
/100
|
#273
Tragic
5.0%

Demographics Similar to Immigrants from Ethiopia by Unemployment Among Ages 45 to 54 years

In terms of unemployment among ages 45 to 54 years, the demographic groups most similar to Immigrants from Ethiopia are Immigrants from Malaysia (4.4%, a difference of 0.040%), Argentinean (4.3%, a difference of 0.16%), Mongolian (4.3%, a difference of 0.17%), Ukrainian (4.3%, a difference of 0.19%), and Indonesian (4.4%, a difference of 0.19%).
DemographicsRating | RankUnemployment Among Ages 45 to 54 years
Immigrants | Turkey
96.9
/100
|
#88
Exceptional
4.3%
Immigrants | Argentina
96.9
/100
|
#89
Exceptional
4.3%
Asians
96.8
/100
|
#90
Exceptional
4.3%
Ukrainians
96.6
/100
|
#91
Exceptional
4.3%
Mongolians
96.6
/100
|
#92
Exceptional
4.3%
Argentineans
96.5
/100
|
#93
Exceptional
4.3%
Immigrants | Malaysia
96.2
/100
|
#94
Exceptional
4.4%
Immigrants | Ethiopia
96.1
/100
|
#95
Exceptional
4.4%
Indonesians
95.4
/100
|
#96
Exceptional
4.4%
Immigrants | Canada
95.0
/100
|
#97
Exceptional
4.4%
Romanians
94.9
/100
|
#98
Exceptional
4.4%
Immigrants | Burma/Myanmar
94.9
/100
|
#99
Exceptional
4.4%
Immigrants | Eritrea
94.7
/100
|
#100
Exceptional
4.4%
Immigrants | North America
93.9
/100
|
#101
Exceptional
4.4%
Sri Lankans
93.7
/100
|
#102
Exceptional
4.4%