French vs Central American Indian Unemployment Among Women with Children Under 18 years
COMPARE
French
Central American Indian
Unemployment Among Women with Children Under 18 years
Unemployment Among Women with Children Under 18 years Comparison
French
Central American Indians
5.2%
UNEMPLOYMENT AMONG WOMEN WITH CHILDREN UNDER 18 YEARS
88.4/ 100
METRIC RATING
113th/ 347
METRIC RANK
6.7%
UNEMPLOYMENT AMONG WOMEN WITH CHILDREN UNDER 18 YEARS
0.0/ 100
METRIC RATING
319th/ 347
METRIC RANK
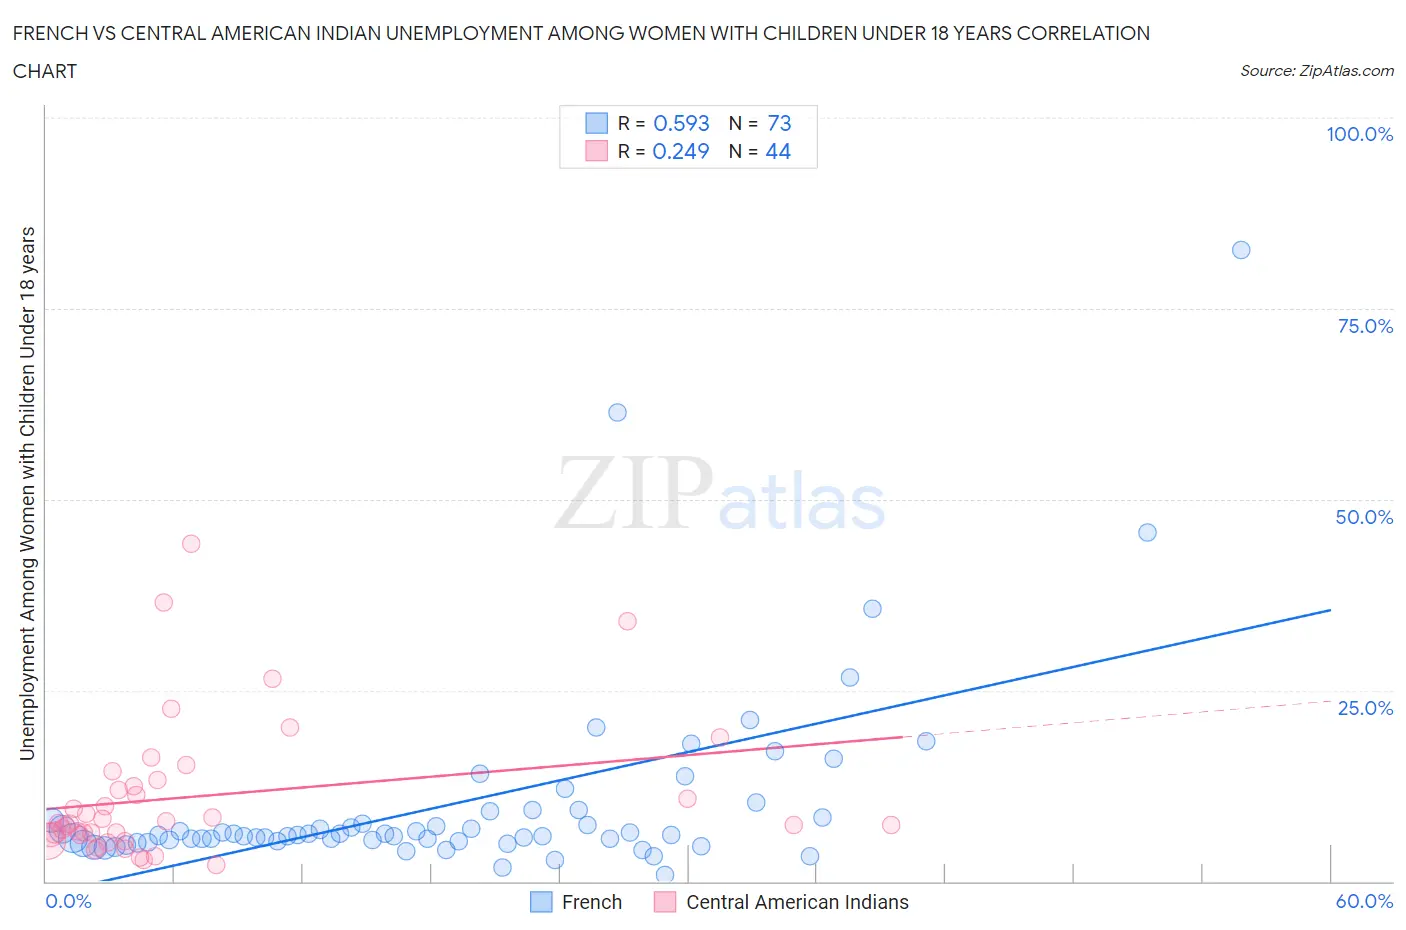
French vs Central American Indian Unemployment Among Women with Children Under 18 years Correlation Chart
The statistical analysis conducted on geographies consisting of 516,708,642 people shows a substantial positive correlation between the proportion of French and unemployment rate among women with children under the age of 18 in the United States with a correlation coefficient (R) of 0.593 and weighted average of 5.2%. Similarly, the statistical analysis conducted on geographies consisting of 319,090,954 people shows a weak positive correlation between the proportion of Central American Indians and unemployment rate among women with children under the age of 18 in the United States with a correlation coefficient (R) of 0.249 and weighted average of 6.7%, a difference of 27.1%.
Unemployment Among Women with Children Under 18 years Correlation Summary
| Measurement | French | Central American Indian |
| Minimum | 0.90% | 2.1% |
| Maximum | 82.7% | 44.2% |
| Range | 81.8% | 42.1% |
| Mean | 10.2% | 11.1% |
| Median | 6.0% | 7.6% |
| Interquartile 25% (IQ1) | 5.2% | 6.0% |
| Interquartile 75% (IQ3) | 8.8% | 12.8% |
| Interquartile Range (IQR) | 3.5% | 6.8% |
| Standard Deviation (Sample) | 12.8% | 9.2% |
| Standard Deviation (Population) | 12.7% | 9.1% |
Similar Demographics by Unemployment Among Women with Children Under 18 years
Demographics Similar to French by Unemployment Among Women with Children Under 18 years
In terms of unemployment among women with children under 18 years, the demographic groups most similar to French are Immigrants from Eastern Europe (5.2%, a difference of 0.010%), Kenyan (5.3%, a difference of 0.040%), Hungarian (5.3%, a difference of 0.050%), Immigrants from Czechoslovakia (5.2%, a difference of 0.090%), and French Canadian (5.2%, a difference of 0.090%).
| Demographics | Rating | Rank | Unemployment Among Women with Children Under 18 years |
| Pakistanis | 89.9 /100 | #106 | Excellent 5.2% |
| Slavs | 89.8 /100 | #107 | Excellent 5.2% |
| Iranians | 89.7 /100 | #108 | Excellent 5.2% |
| Immigrants | Russia | 89.0 /100 | #109 | Excellent 5.2% |
| Immigrants | Czechoslovakia | 88.9 /100 | #110 | Excellent 5.2% |
| French Canadians | 88.9 /100 | #111 | Excellent 5.2% |
| Immigrants | Eastern Europe | 88.5 /100 | #112 | Excellent 5.2% |
| French | 88.4 /100 | #113 | Excellent 5.2% |
| Kenyans | 88.2 /100 | #114 | Excellent 5.3% |
| Hungarians | 88.1 /100 | #115 | Excellent 5.3% |
| Macedonians | 87.7 /100 | #116 | Excellent 5.3% |
| Canadians | 87.4 /100 | #117 | Excellent 5.3% |
| Immigrants | Europe | 86.7 /100 | #118 | Excellent 5.3% |
| Basques | 86.5 /100 | #119 | Excellent 5.3% |
| Egyptians | 86.4 /100 | #120 | Excellent 5.3% |
Demographics Similar to Central American Indians by Unemployment Among Women with Children Under 18 years
In terms of unemployment among women with children under 18 years, the demographic groups most similar to Central American Indians are Immigrants from Belize (6.7%, a difference of 0.090%), U.S. Virgin Islander (6.7%, a difference of 0.14%), Alaska Native (6.7%, a difference of 0.24%), Shoshone (6.6%, a difference of 0.53%), and Immigrants from Ecuador (6.6%, a difference of 0.57%).
| Demographics | Rating | Rank | Unemployment Among Women with Children Under 18 years |
| Immigrants | Mexico | 0.0 /100 | #312 | Tragic 6.6% |
| Hispanics or Latinos | 0.0 /100 | #313 | Tragic 6.6% |
| British West Indians | 0.0 /100 | #314 | Tragic 6.6% |
| Immigrants | West Indies | 0.0 /100 | #315 | Tragic 6.6% |
| Immigrants | Ecuador | 0.0 /100 | #316 | Tragic 6.6% |
| Shoshone | 0.0 /100 | #317 | Tragic 6.6% |
| Alaska Natives | 0.0 /100 | #318 | Tragic 6.7% |
| Central American Indians | 0.0 /100 | #319 | Tragic 6.7% |
| Immigrants | Belize | 0.0 /100 | #320 | Tragic 6.7% |
| U.S. Virgin Islanders | 0.0 /100 | #321 | Tragic 6.7% |
| Houma | 0.0 /100 | #322 | Tragic 6.8% |
| Pueblo | 0.0 /100 | #323 | Tragic 6.8% |
| Paiute | 0.0 /100 | #324 | Tragic 6.9% |
| Immigrants | Dominica | 0.0 /100 | #325 | Tragic 7.0% |
| Chippewa | 0.0 /100 | #326 | Tragic 7.0% |